Use the sample of the greenhouse gas emissions of 32 different cars. (The amounts are in tons per year, expressed as CO2 equivalents.) Use a 0.05 significance level to test the claim that all cars have a mean greenhouse gas emission of 8.00 tons. Find the statistic, p-value and the critical value (or values). (I can ask for the satistic ,p value and critical value separately if needed) Data: Car GHG Acura RL 8.7 Acura TSX 7.2 Audi A6 7.7 BMW 525i 7.7 Buick LaCrosse 7.9 Cadillac STS 8.7 Chevrolet Impala 8.2 Chevrolet Malibu 6.8 Chrysler 300 9.3 Dodge Charger 9.3 Dodge Stratus 7.4 Ford Crown Victoria 9.3 Ford Focus 6.5 Honda Accord 6.6 Hyundai Elantra 6.7 Infiniti M35 9 Jaguar XJ8 8.6 Kia Amanti 9.3 Kia Spectra 6.5 Lexus GS300 7.4 Lexus LS 8.7 Lincoln Town Car 9.3 Mazda 3 6.5 Mercedes-Benz E 7 Mercury Grand Marquis 9.3 Nissan Altima 7.1 Pontiac G6 7.2 Saturn Ion 6.7 Toyota Avalon 7.2 Toyota Corolla 5.5 Volkswagon Passat 7.3 Volvo S80 8.2
Use the sample of the greenhouse gas emissions of 32 different cars. (The amounts are in tons per year, expressed as CO2 equivalents.) Use a 0.05 significance level to test the claim that all cars have a mean greenhouse gas emission of 8.00 tons. Find the statistic, p-value and the critical value (or values). (I can ask for the satistic ,p value and critical value separately if needed) Data: Car GHG Acura RL 8.7 Acura TSX 7.2 Audi A6 7.7 BMW 525i 7.7 Buick LaCrosse 7.9 Cadillac STS 8.7 Chevrolet Impala 8.2 Chevrolet Malibu 6.8 Chrysler 300 9.3 Dodge Charger 9.3 Dodge Stratus 7.4 Ford Crown Victoria 9.3 Ford Focus 6.5 Honda Accord 6.6 Hyundai Elantra 6.7 Infiniti M35 9 Jaguar XJ8 8.6 Kia Amanti 9.3 Kia Spectra 6.5 Lexus GS300 7.4 Lexus LS 8.7 Lincoln Town Car 9.3 Mazda 3 6.5 Mercedes-Benz E 7 Mercury Grand Marquis 9.3 Nissan Altima 7.1 Pontiac G6 7.2 Saturn Ion 6.7 Toyota Avalon 7.2 Toyota Corolla 5.5 Volkswagon Passat 7.3 Volvo S80 8.2

Glencoe Algebra 1, Student Edition, 9780079039897, 0079039898, 2018
18th Edition
ISBN:9780079039897
Author:Carter
Publisher:Carter
Chapter4: Equations Of Linear Functions
Section: Chapter Questions
Problem 8SGR

Related questions
Topic Video
Question
100%
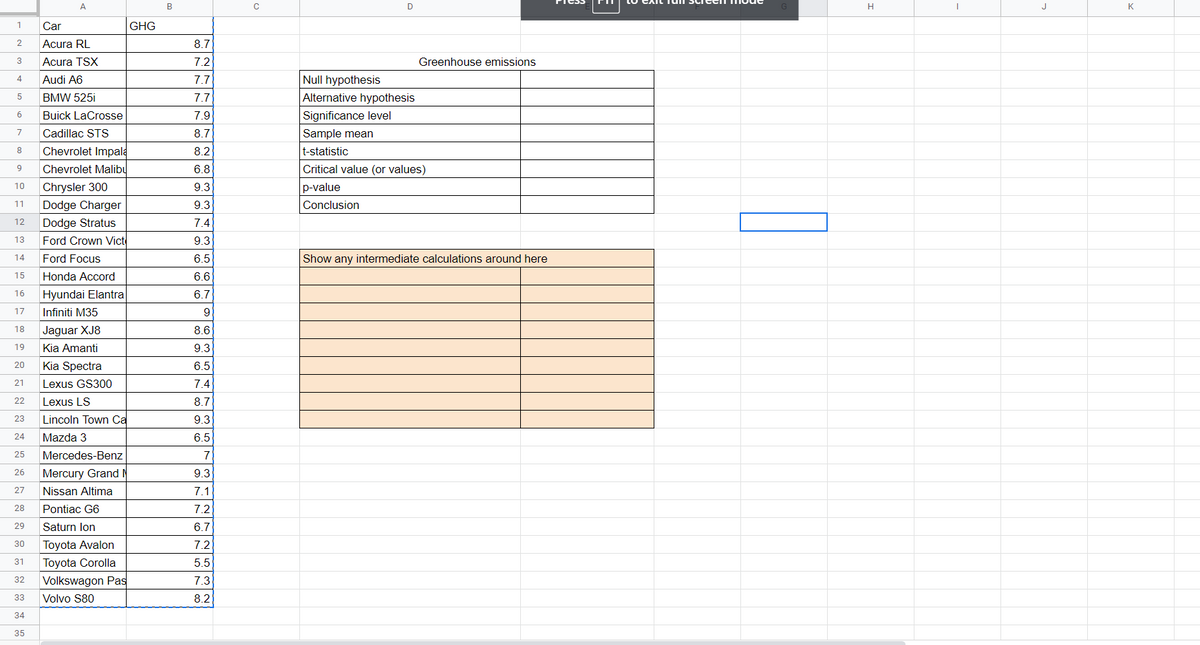
Use the sample of the greenhouse gas emissions of 32 different cars. (The amounts are in tons per year, expressed as CO2 equivalents.) Use a 0.05 significance level to test the claim that all cars have a mean greenhouse gas emission of 8.00 tons. Find the statistic, p-value and the critical value (or values).
(I can ask for the satistic ,p value and critical value separately if needed)
Data:
| Car | GHG |
| Acura RL | 8.7 |
| Acura TSX | 7.2 |
| Audi A6 | 7.7 |
| BMW 525i | 7.7 |
| Buick LaCrosse | 7.9 |
| Cadillac STS | 8.7 |
| Chevrolet Impala | 8.2 |
| Chevrolet Malibu | 6.8 |
| Chrysler 300 | 9.3 |
| Dodge Charger | 9.3 |
| Dodge Stratus | 7.4 |
| Ford Crown Victoria | 9.3 |
| Ford Focus | 6.5 |
| Honda Accord | 6.6 |
| Hyundai Elantra | 6.7 |
| Infiniti M35 | 9 |
| Jaguar XJ8 | 8.6 |
| Kia Amanti | 9.3 |
| Kia Spectra | 6.5 |
| Lexus GS300 | 7.4 |
| Lexus LS | 8.7 |
| Lincoln Town Car | 9.3 |
| Mazda 3 | 6.5 |
| Mercedes-Benz E | 7 |
| Mercury Grand Marquis | 9.3 |
| Nissan Altima | 7.1 |
| Pontiac G6 | 7.2 |
| Saturn Ion | 6.7 |
| Toyota Avalon | 7.2 |
| Toyota Corolla | 5.5 |
| Volkswagon Passat | 7.3 |
| Volvo S80 | 8.2 |
Transcribed Image Text:A
J
K
1
Car
GHG
Acura RL
8.7
3
Acura TSX
7.2
Greenhouse emissions
Null hypothesis
Alternative hypothesis
4
Audi A6
7.7
BMW 525i
7.7
Significance level
6
Buick LaCrosse
7.9
7
Cadillac STS
8.7
Sample mean
8
Chevrolet Impala
8.2
t-statistic
Chevrolet Malibu
Critical value (or values)
9
6.8
10
Chrysler 300
9.3
p-value
11
Dodge Charger
9.3
Conclusion
12
Dodge Stratus
7.4
Ford Crown Vict
13
9.3
14
Ford Focus
6.5
Show any intermediate calculations around here
15
Honda Accord
6.6
16
Hyundai Elantra
6.7
17
Infiniti M35
18
Jaguar XJ8
8.6
19
Kia Amanti
9.3
20
Kia Spectra
6.5
21
Lexus GS300
7.4
22
Lexus LS
8.7
23
Lincoln Town Ca
9.3
24
Mazda 3
6.5
25
Mercedes-Benz
Mercury Grand
26
9.3
27
Nissan Altima
7.1
28
Pontiac G6
7.2
29
Saturn lon
6.7
30
Toyota Avalon
7.2
31
Toyota Corolla
5.5
Volkswagon Pas
32
7.3
33
Volvo S80
8.2
34
35
Expert Solution
Step 1
Given:
Sample size of cars (n) = 32
Hypothesized mean
The green house emissions of all the cars in a sample is as follows
| 8.7 |
| 7.2 |
| 7.7 |
| 7.7 |
| 7.9 |
| 8.7 |
| 8.2 |
| 6.8 |
| 9.3 |
| 9.3 |
| 7.4 |
| 9.3 |
| 6.5 |
| 6.6 |
| 6.7 |
| 9 |
| 8.6 |
| 9.3 |
| 6.5 |
| 7.4 |
| 8.7 |
| 9.3 |
| 6.5 |
| 7 |
| 9.3 |
| 7.1 |
| 7.2 |
| 6.7 |
| 7.2 |
| 5.5 |
| 7.3 |
| 8.2 |
Step 2
Calculating sample mean and standard deviation of GHG

Step by step
Solved in 3 steps

Knowledge Booster


Learn more about
Need a deep-dive on the concept behind this application? Look no further. Learn more about this topic, statistics and related others by exploring similar questions and additional content below.Recommended textbooks for you
Glencoe Algebra 1, Student Edition, 9780079039897…
Algebra
ISBN:
9780079039897
Author:
Carter
Publisher:
McGraw Hill
Glencoe Algebra 1, Student Edition, 9780079039897…
Algebra
ISBN:
9780079039897
Author:
Carter
Publisher:
McGraw Hill