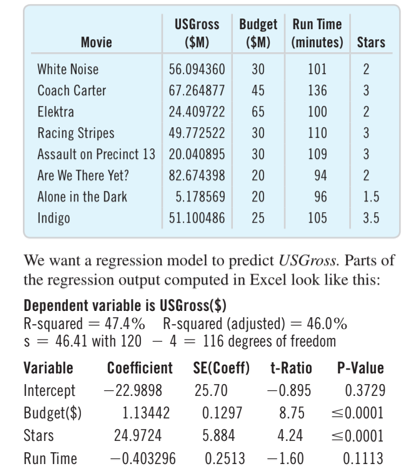
USGross Budget Run Time ($M) Movie ($M) (minutes) Stars White Noise 56.094360 30 101 2 Coach Carter 67.264877 45 136 3 Elektra 24.409722 65 100 2 Racing Stripes 49.772522 30 110 3 Assault on Precinct 13 20.040895 30 109 3 Are We There Yet? 82.674398 20 94 2 Alone in the Dark 5.178569 20 96 1.5 Indigo 51.100486 25 105 3.5 We want a regression model to predict USGross. Parts of the regression output computed in Excel look like this: Dependent variable is USGross($) R-squared = 47.4% R-squared (adjusted) = 46.0% s = 46.41 with 120 – 4 = 116 degrees of freedom Variable Coefficient SE(Coeff) t-Ratio P-Value 25.70 -0.895 Intercept Budget($) -22.9898 0.3729 1.13442 0.1297 8.75 <0.0001 Stars 24.9724 5.884 4.24 <0.0001 Run Time -0.403296 0.2513 -1.60 0.1113


Correlation
Correlation defines a relationship between two independent variables. It tells the degree to which variables move in relation to each other. When two sets of data are related to each other, there is a correlation between them.
Linear Correlation
A correlation is used to determine the relationships between numerical and categorical variables. In other words, it is an indicator of how things are connected to one another. The correlation analysis is the study of how variables are related.
Regression Analysis
Regression analysis is a statistical method in which it estimates the relationship between a dependent variable and one or more independent variable. In simple terms dependent variable is called as outcome variable and independent variable is called as predictors. Regression analysis is one of the methods to find the trends in data. The independent variable used in Regression analysis is named Predictor variable. It offers data of an associated dependent variable regarding a particular outcome.
will make? We have data on a number of movies that includes
the USGross (in $), the Budget ($), the Run Time (minutes),
and the average number of Stars awarded by reviewers. The
first several entries in the data table look like this:
the regression output computed in Excel look like this:
Dependent variable is USGross($)
R-squared = 47.4, R-squared (adjusted) = 46.0,
s = 46.41 with 120 - 4 = 116 degrees of freedom
Variable Coefficient SE(Coeff) t-Ratio P-Value
Intercept -22.9898 25.70 -0.895 0.3729
Budget($) 1.13442 0.1297 8.75 ...0.0001
Stars 24.9724 5.884 4.24 ...0.0001
Run Time -0.403296 0.2513 -1.60 0.1113
b) What is the interpretation of the coefficient of Budget
in this regression model?


Trending now
This is a popular solution!

Step by step
Solved in 2 steps


