Using the educational attainment dataset, what is the P(Bachelor's Degree or more | Female aged 25 to 39)? 0.36 O 0.44 0.57 O 0.78
Using the educational attainment dataset, what is the P(Bachelor's Degree or more | Female aged 25 to 39)? 0.36 O 0.44 0.57 O 0.78

MATLAB: An Introduction with Applications
6th Edition
ISBN:9781119256830
Author:Amos Gilat
Publisher:Amos Gilat
Chapter1: Starting With Matlab
Section: Chapter Questions
Problem 1P

Related questions
Topic Video
Question
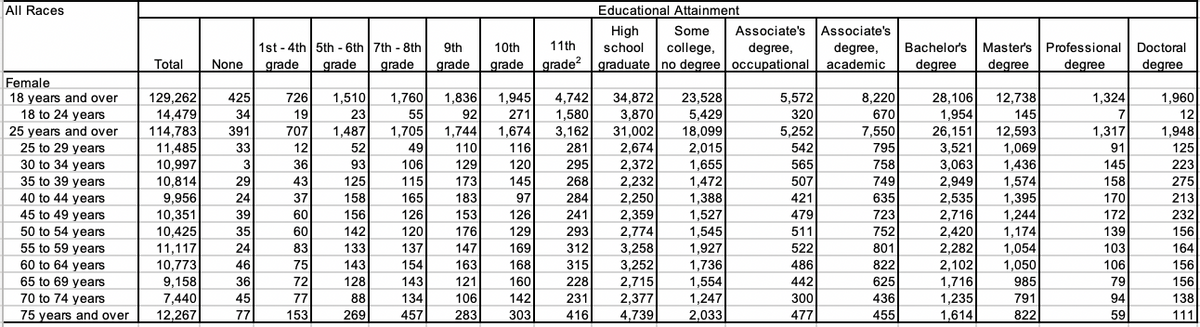
Transcribed Image Text:All Races
Educational Attainment
Associate's Associate's
High
school
Some
1st - 4th 5th - 6th 7th - 8th
9th
10th
11th
college,
degree,
degree,
Bachelor's Master's
Professional Doctoral
Total
None
grade
grade
grade
grade
grade
grade? graduate no degree occupational academic
degree
degree
degree
degree
Female
129,262
726
1,760
1,945
23,528
1,324
18 years and over
18 to 24 years
425
1,510
1,836
4,742
1,580
3,162
34,872
3,870
31,002
2,674
5,572
8,220
28,106
1,954
12,738
1,960
14,479
114,783
11,485
10,997
10,814
34
19
23
55
92
271
5,429
18,099
2,015
1,655
1,472
1,388
320
670
145
7
12
7,550
12,593
1,069
1,436
25 years and over
391
707
1,487
1,705
1,744
1,674
5,252
26,151
1,317
1,948
25 to 29 years
30 to 34 years
35 to 39 years
40 to 44 years
45 to 49 years
50 to 54 years
55 to 59 years
60 to 64 years
65 to 69 years
70 to 74 years
3,521
3,063
33
12
52
49
110
116
281
542
795
91
125
3
36
93
106
129
120
295
2,372
2,232
2,250
2,359
2,774
565
758
145
223
1,574
1,395
29
43
125
115
173
145
268
507
749
2,949
158
275
2,535
9,956
10,351
10,425
24
37
158
165
183
97
284
421
635
170
213
1,527
1,545
1,927
1,736
2,716
1,244
1,174
1,054
1,050
39
60
156
126
153
126
241
479
723
172
232
293
2,420
2,282
35
60
142
120
176
129
511
752
139
156
11,117
24
83
133
137
147
169
312
3,258
522
801
103
164
10,773
46
75
143
154
163
168
315
3,252
2,715
486
822
2,102
1,716
1,235
106
156
9,158
7,440
12,267
36
72
128
143
121
160
228
1,554
442
625
985
79
156
2,377
4,739
45
77
88
134
106
142
231
1,247
300
436
791
94
138
75 years and over
77
153
269
457
283
303
416
2,033
477
455
1,614
822
59
111
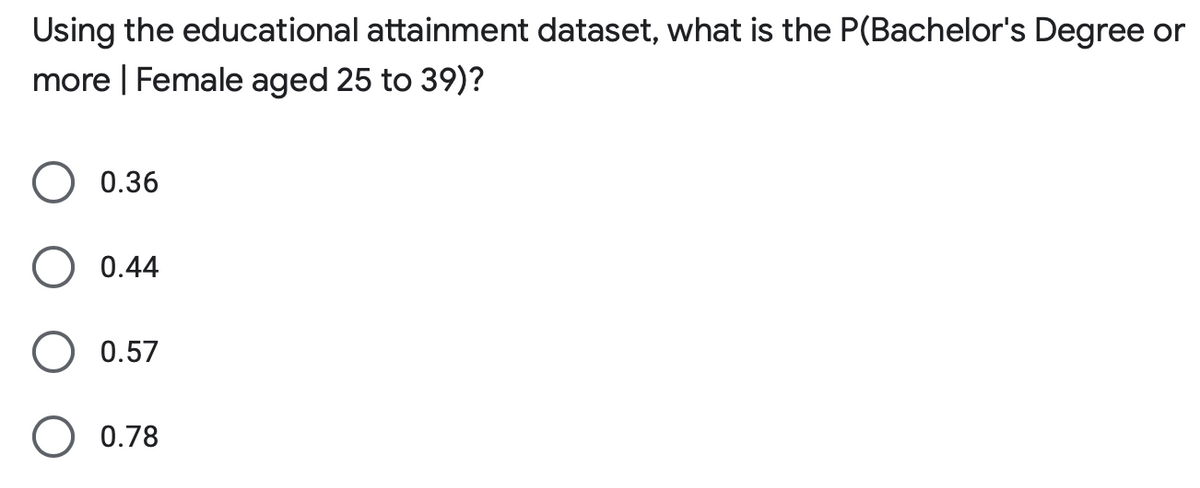
Transcribed Image Text:Using the educational attainment dataset, what is the P(Bachelor's Degree or
more | Female aged 25 to 39)?
0.36
0.44
0.57
O 0.78
Expert Solution
This question has been solved!
Explore an expertly crafted, step-by-step solution for a thorough understanding of key concepts.

Step by step
Solved in 2 steps

Knowledge Booster


Learn more about
Need a deep-dive on the concept behind this application? Look no further. Learn more about this topic, statistics and related others by exploring similar questions and additional content below.Recommended textbooks for you
MATLAB: An Introduction with Applications
Statistics
ISBN:
9781119256830
Author:
Amos Gilat
Publisher:
John Wiley & Sons Inc

Probability and Statistics for Engineering and th…
Statistics
ISBN:
9781305251809
Author:
Jay L. Devore
Publisher:
Cengage Learning

Statistics for The Behavioral Sciences (MindTap C…
Statistics
ISBN:
9781305504912
Author:
Frederick J Gravetter, Larry B. Wallnau
Publisher:
Cengage Learning
MATLAB: An Introduction with Applications
Statistics
ISBN:
9781119256830
Author:
Amos Gilat
Publisher:
John Wiley & Sons Inc
Probability and Statistics for Engineering and th…
Statistics
ISBN:
9781305251809
Author:
Jay L. Devore
Publisher:
Cengage Learning
Statistics for The Behavioral Sciences (MindTap C…
Statistics
ISBN:
9781305504912
Author:
Frederick J Gravetter, Larry B. Wallnau
Publisher:
Cengage Learning

Elementary Statistics: Picturing the World (7th E…
Statistics
ISBN:
9780134683416
Author:
Ron Larson, Betsy Farber
Publisher:
PEARSON

The Basic Practice of Statistics
Statistics
ISBN:
9781319042578
Author:
David S. Moore, William I. Notz, Michael A. Fligner
Publisher:
W. H. Freeman

Introduction to the Practice of Statistics
Statistics
ISBN:
9781319013387
Author:
David S. Moore, George P. McCabe, Bruce A. Craig
Publisher:
W. H. Freeman