Using the following combinations as Production Possibilities data for consumer goods and capital goods, answer the following questions: 1a. A E Consumer Goods 25 50 75 100 Capital Goods 100 90 75 45 b. In the space below, graph the above production possibilities schedule (label everything):
Using the following combinations as Production Possibilities data for consumer goods and capital goods, answer the following questions: 1a. A E Consumer Goods 25 50 75 100 Capital Goods 100 90 75 45 b. In the space below, graph the above production possibilities schedule (label everything):

Chapter2: Productions Possibilities, Opportunity Costs, And Economic Growth
Section: Chapter Questions
Problem 6SQP

Related questions
Question
Can you help with e and f?
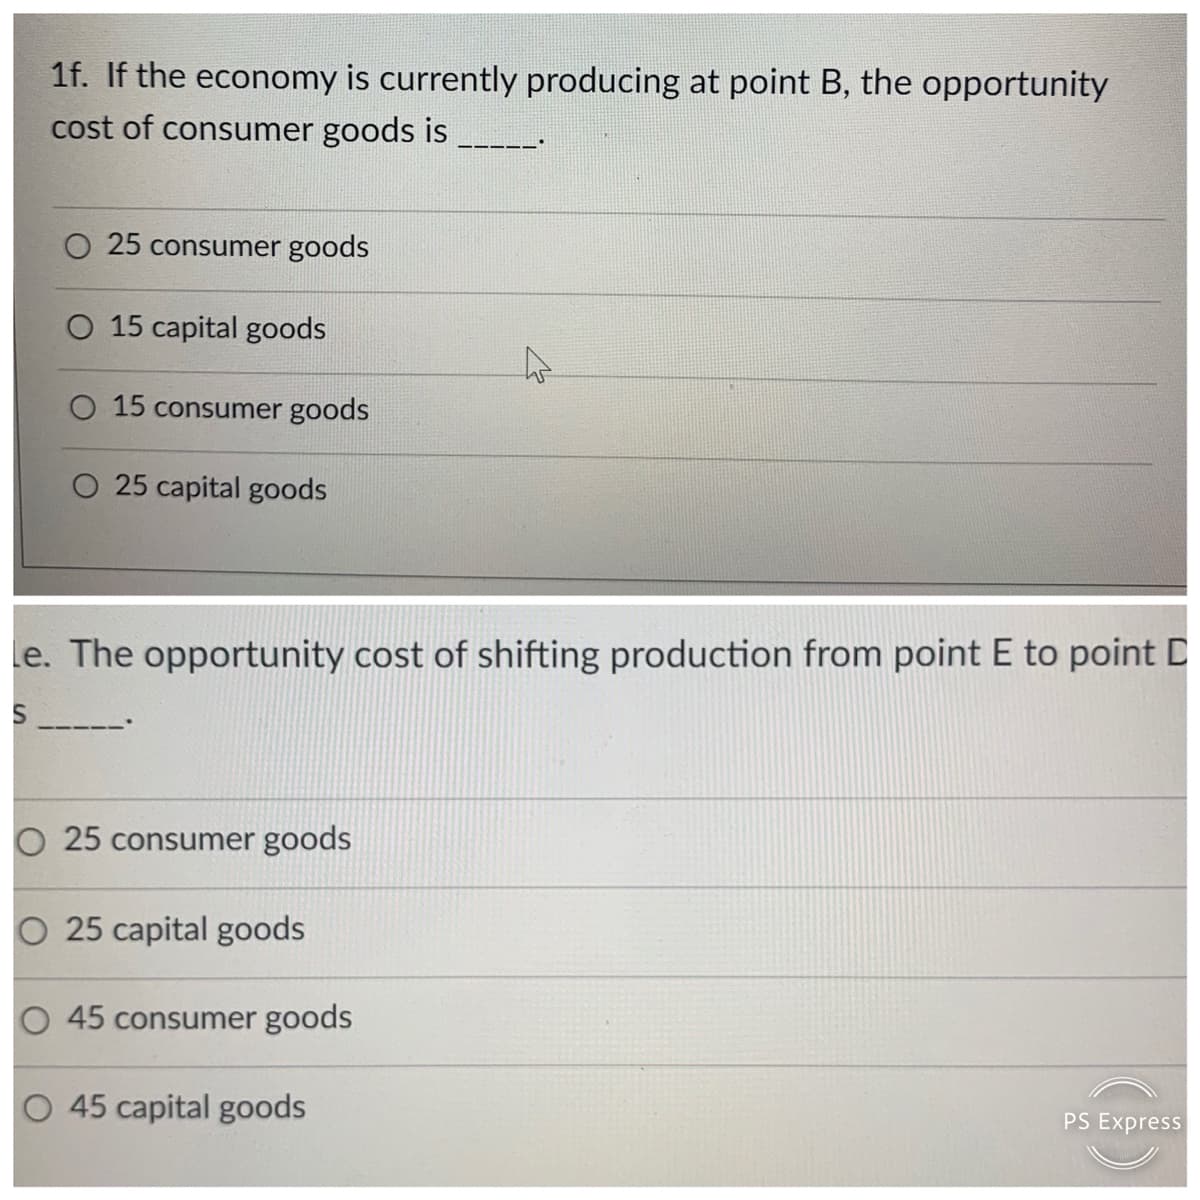
Transcribed Image Text:1f. If the economy is currently producing at point B, the opportunity
cost of consumer goods is
O 25 consumer goods
O 15 capital goods
O 15 consumer goods
O 25 capital goods
le. The opportunity cost of shifting production from point E to point D
O 25 consumer goods
25 capital goods
O 45 consumer goods
O 45 capital goods
PS Express
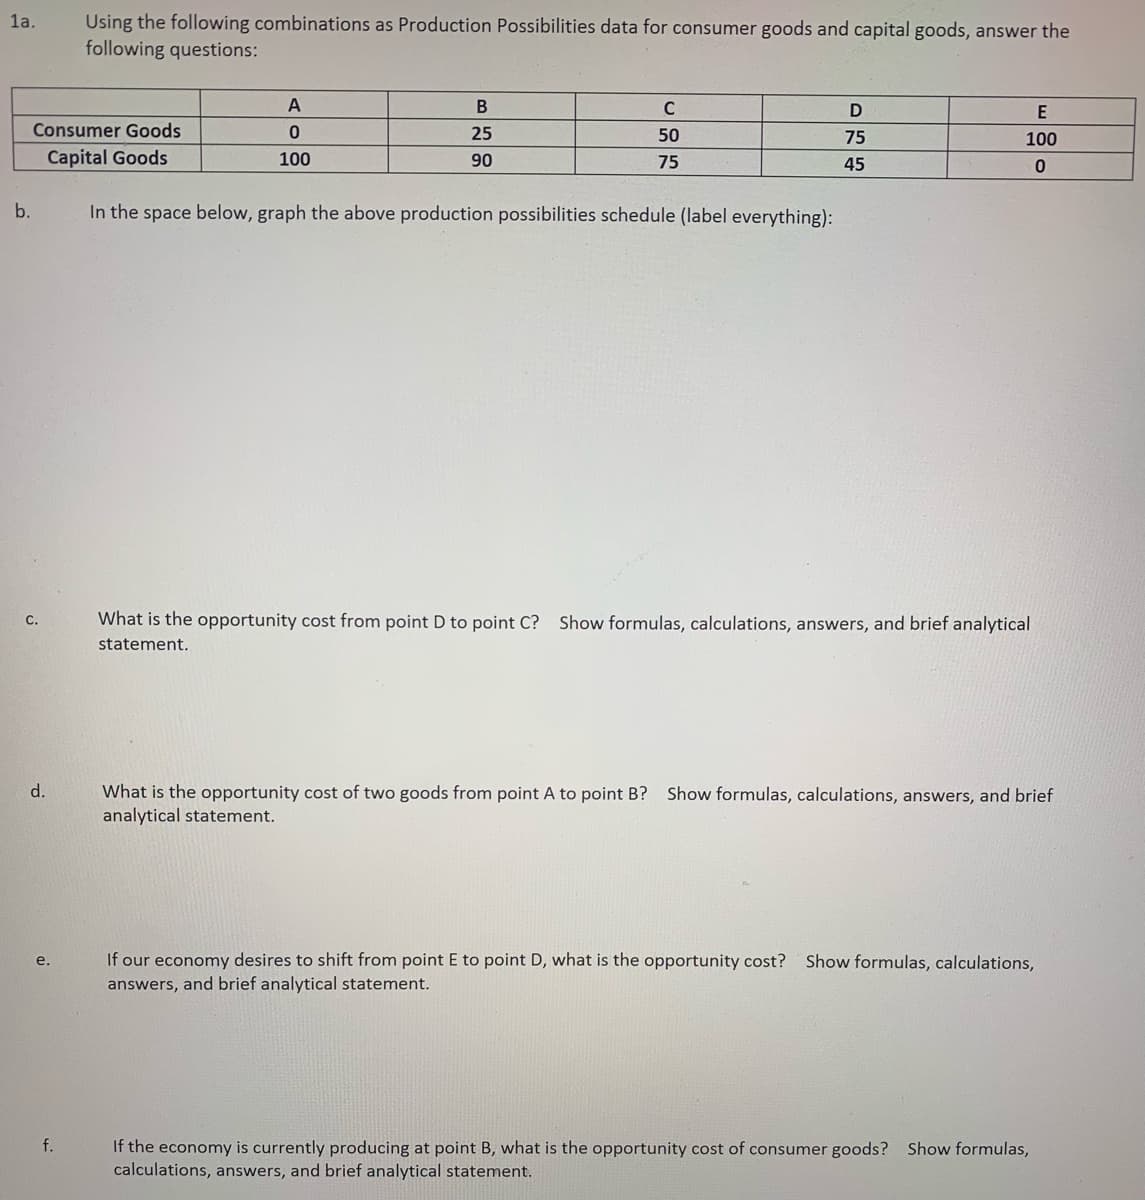
Transcribed Image Text:Using the following combinations as Production Possibilities data for consumer goods and capital goods, answer the
following questions:
1a.
A
E
Consumer Goods
25
50
75
100
Capital Goods
100
90
75
45
b.
In the space below, graph the above production possibilities schedule (label everything):
С.
What is the opportunity cost from point D to point C? Show formulas, calculations, answers, and brief analytical
statement.
d.
What is the opportunity cost of two goods from point A to point B? Show formulas, calculations, answers, and brief
analytical statement.
If our economy desires to shift from point E to point D, what is the opportunity cost?
answers, and brief analytical statement.
e.
Show formulas, calculations,
f.
If the economy is currently producing at point B, what is the opportunity cost of consumer goods? Show formulas,
calculations, answers, and brief analytical statement.
Expert Solution
This question has been solved!
Explore an expertly crafted, step-by-step solution for a thorough understanding of key concepts.

This is a popular solution!

Includes step-by-step video

Trending now
This is a popular solution!

Learn your way
Includes step-by-step video

Step by step
Solved in 2 steps

Recommended textbooks for you


Exploring Economics
Economics
ISBN:
9781544336329
Author:
Robert L. Sexton
Publisher:
SAGE Publications, Inc
Exploring Economics
Economics
ISBN:
9781544336329
Author:
Robert L. Sexton
Publisher:
SAGE Publications, Inc


