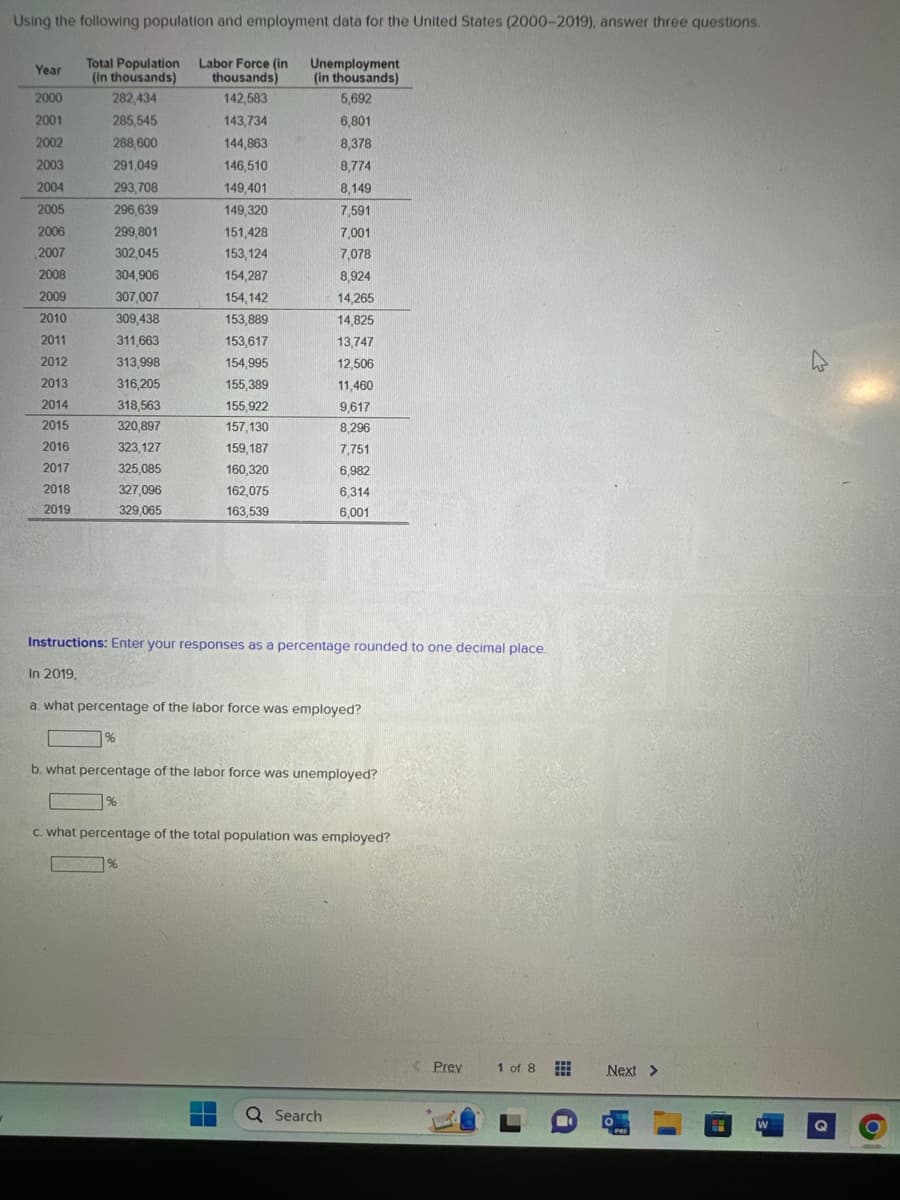
Using the following population and employment data for the United States (2000-2019), answer three questions. Total Population Labor Force (in (in thousands) thousands) 282,434 142,583 285,545 288,600 291,049 293,708 296,639 Year 2000 2001 2002 2003 2004 2005 2006 2007 2008 2009 2010 2011 2012 2013 2014 2015 2016 2017 2018 2019 299,801 302,045 304,906 307,007 309,438 311,663 313,998 316,205 318,563 320,897 323,127 325,085 327,096 329,065 143,734 144,863 146,510 149,401 149,320 151,428 153,124 154,287 154,142 153,889 153,617 154,995 155,389 155,922 157,130 159,187 160,320 162,075 163,539 Unemployment (in thousands) 5,692 6,801 8,378 8,774 8,149 7,591 7,001 7,078 8,924 14,265 14,825 13,747 12,506 11,460 9,617 8,296 7,751 6,982 6,314 6,001
Using the following population and employment data for the United States (2000-2019), answer three questions. Total Population Labor Force (in (in thousands) thousands) 282,434 142,583 285,545 288,600 291,049 293,708 296,639 Year 2000 2001 2002 2003 2004 2005 2006 2007 2008 2009 2010 2011 2012 2013 2014 2015 2016 2017 2018 2019 299,801 302,045 304,906 307,007 309,438 311,663 313,998 316,205 318,563 320,897 323,127 325,085 327,096 329,065 143,734 144,863 146,510 149,401 149,320 151,428 153,124 154,287 154,142 153,889 153,617 154,995 155,389 155,922 157,130 159,187 160,320 162,075 163,539 Unemployment (in thousands) 5,692 6,801 8,378 8,774 8,149 7,591 7,001 7,078 8,924 14,265 14,825 13,747 12,506 11,460 9,617 8,296 7,751 6,982 6,314 6,001
Chapter6: How Statisticians Measure Inflation
Section6.A: How Statisticians Measure Inflation
Problem 4TY
Related questions
Question

Transcribed Image Text:Using the following population and employment data for the United States (2000-2019), answer three questions.
Total Population Labor Force (in
(in thousands) thousands)
282,434
142,583
285,545
288,600
291,049
293,708
296,639
299,801
302,045
304,906
307,007
309,438
311,663
313,998
Year
2000
2001
2002
2003
2004
2005
2006
2007
2008
2009
2010
2011
2012
2013
2014
2015
2016
2017
2018
2019
316,205
318,563
320,897
323,127
325,085
327,096
329,065
%
143,734
144,863
146,510
149,401
149,320
151,428
153,124
154,287
154,142
153,889
153,617
154,995
155,389
155,922
157,130
159,187
160,320
162,075
163,539
%
Unemployment
(in thousands)
5,692
6,801
8,378
8,774
8,149
7,591
Instructions: Enter your responses as a percentage rounded to one decimal place.
In 2019,
%
7,001
7,078
a. what percentage of the labor force was employed?
8,924
14,265
14,825
13,747
12,506
11,460
9,617
8,296
7,751
6,982
6,314
6,001
b. what percentage of the labor force was unemployed?
Q Search
c. what percentage of the total population was employed?
Prev
1 of 8
Next >
PRE
W
4
O
Expert Solution
This question has been solved!
Explore an expertly crafted, step-by-step solution for a thorough understanding of key concepts.
This is a popular solution!
Trending now
This is a popular solution!
Step by step
Solved in 5 steps

Knowledge Booster
Learn more about
Need a deep-dive on the concept behind this application? Look no further. Learn more about this topic, economics and related others by exploring similar questions and additional content below.Recommended textbooks for you

