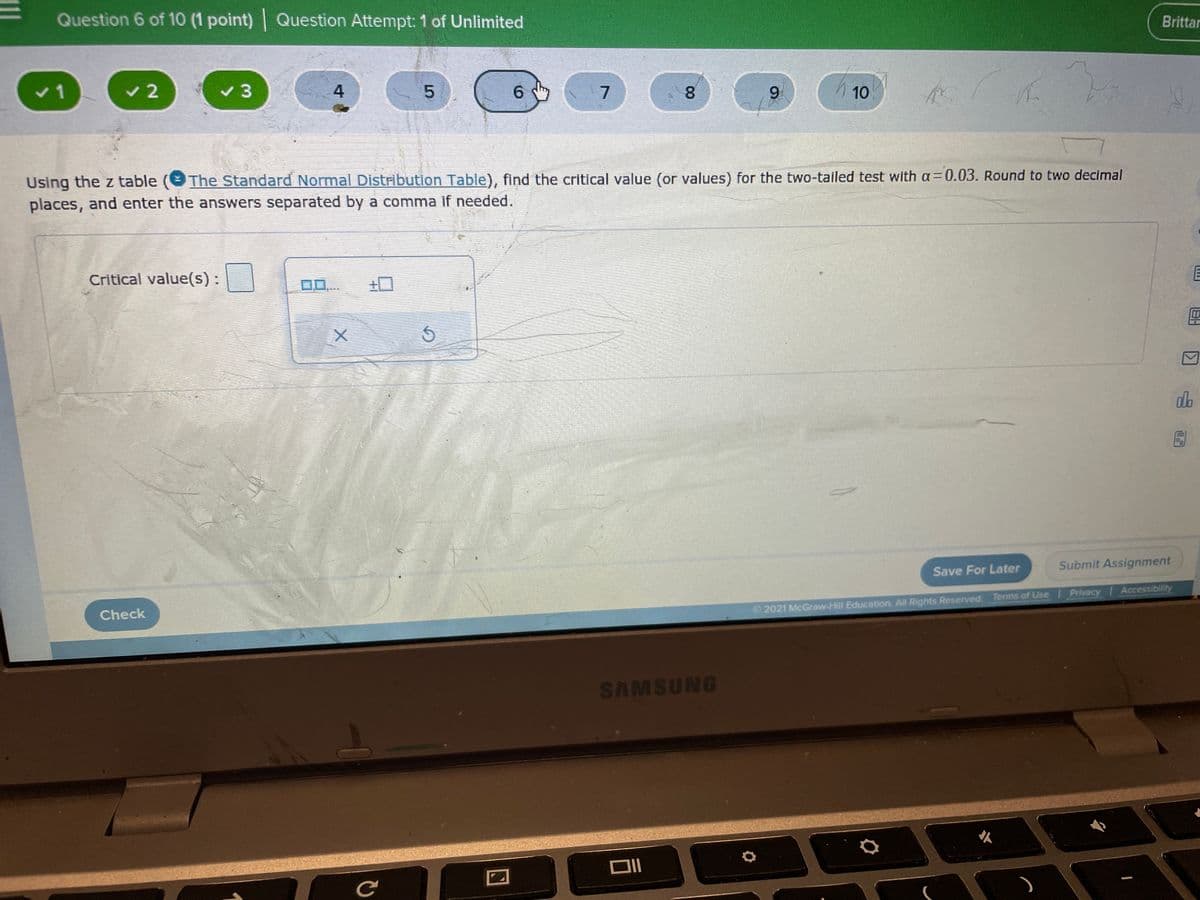
Using the z table (O The Standard Normal Distribution Table), find the critical value (or values) for the two-tailed test with a=0.03. Round to two decimal places, and enter the answers separated by a comma if needed. Critical value(s):
Q: Find the indicated z score. The graph depicts the standard normal distribution with mean 0 and…
A: Given probability is P(Z<z0)=0.2148
Q: Using the standarad normal distribution table (z-table), determine the value for z that solves P(Z <…
A: Given: P(Z<z) = 0.5
Q: Find the indicated z score. The graph depicts the standard normal distribution with mean 0 and…
A: Given Graph is, P(Z>z)=0.7852 z=?
Q: Find the indicated z score. The graph depicts the standard normal distribution with mean 0 and…
A:
Q: Find the indicated z score. The graph depicts the standard normal distribution with mean 0 and…
A: According to the given information, we have Mean = 0 Standard deviation = 1 P-value = 0.7642 (Right…
Q: Find the indicated z score. The graph depicts the standard normal distribution with mean 0 and…
A: We have to solve given problem:
Q: Find the indicated z score. The graph depicts the standard normal distribution with mean 0 and…
A:
Q: Find the indicated z score . The graph depicts the standard normal distribution with mean 0 and…
A:
Q: Find the indicated z score. The graph depicts the standard normal distribution with mean 0 and…
A: We have to find z score..
Q: Find the indicatedz score. The graph depicts the standard normal distribution with mean 0 and…
A: From the given graph let z be the score P(Z<z) = 0.1635 From the z table/normal table…
Q: Find the indicated z score. The graph depicts the standard normal distribution with mean 0 and…
A:
Q: Find the indicated z score. The graph depicts the standard normal distribution with mean 0 and…
A: Given that:Z is standard normal Distributed with i.e. mean µ =0 and standard deviation σ =1 By…
Q: Find the indicated z score. The graph depicts the standard normal distribution with mean 0 and…
A: Given: PZ<z=0.9830.
Q: Find the indicated z score. The graph depicts the standard normal distribution with mean 0 and…
A:
Q: Find the indicated z score. The graph depicts the standard normal distribution with mean 0 and…
A: Let z denote the standard normal random variable with mean of μ=0 and standard deviation of σ=1 The…
Q: Find the indicated z score. The graph depicts the standard normal distribution with mean 0 and…
A:
Q: Find the indicated z score. The graph depicts the standard normal distribution with mean and…
A: Solution: From the given information,
Q: Find the indicated z score. The graph depicts the standard normal distribution with mean 0 and…
A: Solution: 1. The given distribution is standard normal with mean µ=0 and a standard deviation σ=1.
Q: Find the indicated z score. The graph depicts the standard normal distribution with mean 0 and…
A: Let Z be random variable from standard normal distribution with mean = 0 and standard deviation = 1…
Q: Find the indicated z score. The graph depicts the standard normal distribution with mean 0 and…
A: Given that: Z is standard normal Distributed with i.e. mean µ =0 and standard deviation σ =1 now…
Q: Find the area of the shaded region. The graph depicts the standard normal distribution with mean 0…
A: Given that, Z score = 0.22Left tailed test
Q: Find the indicated z score. The graph depicts the standard normal distribution with mean 0 and…
A: Given graph: z-score=?
Q: Find the indicated z score. The graph depicts the standard normal distribution with mean 0 and…
A:
Q: Find the area of the shaded region. The graph depicts the standard normal distribution with mean 0…
A:
Q: Find the indicated z score. The graph depicts the standard normal distribution with mean 0 and…
A: Given that : Standard normal distribution with mean 0 and variance 1. Z score = ????
Q: Find the indicated z score. The graph depicts the standard normal distribution with mean 0 and…
A: Solution-: Let, Z- be the standard normal random variable (6) (From inverse standard normal…
Q: Find the indicated z score. The graph depicts the standard normal distribution with mean 0 and…
A:
Q: Find the indicated z score. The graph depicts the standard normal distribution with mean 0 and…
A: We want to find Z-score
Q: Find the indicated z score. The graph depicts the standard normal distribution with mean 0 and…
A: In question, We'll find the indicated z value when the graph is followed standard normal…
Q: Find the indicated z score. The graph depicts the standard normal distribution with mean 0 and…
A:
Q: Find the indicated z score. The graph depicts the standard normal distribution with mean 0 and…
A:
Q: Find the indicated z score. The graph depicts the standard normal distribution with mean 0 and…
A: Here we need to find the indicated z score.
Q: Find the indicated z score. The graph depicts the standard normal distribution with mean 0 and…
A:
Q: Find the indicated z score. The graph depicts the standard normal distribution with mean 0 and…
A: The standard normal variable is z, which follows the normal distribution with the mean of 0 and…
Q: Find the indicated z score. The graph depicts the standard normal distribution with mean 0 and…
A: Given,Mean μ=0sd σ=1P(Z>z)=0.1736z=?
Q: Find the indicated z score. The graph depicts the standard normal distribution with mean 0 and…
A: Refer Standard normal table/Z-table, Lookup for z-score corresponding to area 0.9292 to the left of…
Q: Find the indicated z score. The graph depicts the standard normal distribution with mean 0 and…
A: we have to find z score.
Q: n the standard normal distribution, find the z value that corresponds to the 83rd percentile. Use a…
A: Use TI-83 plus calculator steps to find the z value that corresponds to the 83rd percentile: Press…
Q: Find the area of the shaded region. The graph depicts the standard normal distribution with mean 0…
A: Given that, Mean = 0 Standard deviations = 1 Z-score (Z) = 0.36
Q: Find the indicated z score. The graph depicts the standard normal distribution with mean 0 and…
A: The graph depicts the standard normal distribution with mean 0 and standard deviation 1 We have to…
Q: Find the indicated z score. The graph depicts the standard normal distribution with mean 0 and…
A:
Q: Find the area of the shaded region. The graph depicts the standard normal distribution with mean 0…
A: Given data,Mean μ=0sd σ=1P(Z<0.96)=?
Q: Find the indicated z score. The graph depicts the standard normal distribution with mean 0 and…
A: Given data, P(Z<z)= 0.2061 From z-table for probability 0.2061 the cummulative z-value is -0.82.…
Q: Find the indicated z score. The graph depicts the standard normal distribution with mean O and…
A: From the given information, let z be standard normal variate. The mean of the standard normal…
Q: Find the indicated Z score. The graph depicts the standard normal distribution with mean 0 and…
A: From the provided information, Mean (µ) = 0 Standard deviation (σ) = 1 X~N (0, 1)
Q: indicated z score. Assume the curve is a standard normal distribution with mean 0 and standard…
A: We are given that the it is the standard normal distribution which has mean equal to 0 and standard…
Q: Find the indicated z score. The graph depicts the standard normal distribution with mean 0 and…
A: Let Z be the random variable from standard normal distribution with mean = 0 and standard deviation…
Q: Using the Standard Normal Table, find the proportion of observations from a standard Normal…
A: Finding the proportion of area z < 1.64Using the standard normal table, select row corresponding…
Trending now
This is a popular solution!
Step by step
Solved in 2 steps with 1 images
- 1. the engines made by Alpha-X for boats have an average power of 220 horsepower (HP) and a standard deviation of 15 HP. You can assume the distribution of power follows a normal distribution. Beta-Y is testing the engines and will dispute the company's claim if the simple mean is less than 215 HP. if they take a sample of 4 engines. A. what is the probability the mean is less than 215? B. If Beta-Y samples 100 engines, what is the pribability that the sample mean will be less than 215? 2. the weights of baby kangaroos are known to have a mean of 125 pounds and a standard deviation of 15 pounds. if we obtained a random sample of 40 baby kangaroos. A. what is the probability that the sample mean will be between 120 and 130 pounds? B. what are the confidence intervals having the same number of samples with a 95% confidence level? 3. we heard that there was a 90% confidence interval for the population mean from 22.5 to 28.3, determine A. the point estimate of the population B. the margin…3) To evaluate the effect of a treatment, a sample is obtained from a population (mean = 20). after treatment, the sample mean is found to be 21.3, with a variance (s2) of 9 a) assuming that the sample consists of n = 16, use a 2-tailed hypothesis test with alpha = .05 to determine whether the treatment effect is significant or not. (be sure to calculate the t-statistic and draw a bell-shaped curve with the critical regions highlighted)An experiment is being conducted to compare the tension bond strength of polymer latex modified mortar to that of unmodified mortar. Let μ1 and μ2 be the true mean tension bond strengths for the modified and unmodified mortars respectively. The question of interest is whether the mean bond strength of modified mortars is larger than that of the unmodified mortars. Assume that the bond strength distributions are both normal. Assume that σ1 = 1.6 and σ2 = 1.4. Suppose the investigator decided to use a level 0.05 test and wished β = 0.10 to detect a difference of one unit between the two true means. If she decides to take a sample of size 35 of the modified mortars, what sample size does she need from the second population to accomplish what she wants? (Answer: 45)
- Twenty-one independent measurements were taken of the hardness (on the Rockwell C scale) of HSLA-100 steel base metal, and another 21 independent measurements were made of the hardness of a weld produced on this base metal. The standard deviation of the measurements made on the base metal was 3.06, and the standard deviation of the measurements made on the weld was 1.41. Assume that the measurements are independent random samples from normal populations. Can you conclude that measurements made on the base metal are more variable than measurements made on the weld?Listed in the data table are IQ scores for a random sample of subjects with medium lead levels in their blood. Also listed are statistics from a study done of IQ scores for a random sample of subjects with high lead levels. Assume that the two samples are independent simple random samples selected from normally distributed populations. Do not assume that the population standard deviations are equal. Use a 0.01 significance level.A researcher randomly sampled 30 graduates of an MBA program and recorded data about their starting salaries. Of primary interest to the researcher is whether starting salaries differ based on gender. The researcher performs a pooled-variance t-test of the mean salaries of the females (Population 1) andmales (Population 2) in the sample. Assume α = 0.10. What assumptions are necessary to conduct this hypothesis test? The samples were randomly and independently selected. Both populations of salaries (male and female) must have approximate normal distributions. The population variances are approximately equal.
- Two catalyst may be used in a batch chemiocal process. Twelve batches were preapred using catalyst 1, resulting in an average yield of 86 and a sample standard deviation of 3. Fifteen batches were prepared using catalyst 2, and they resulted in an average yield of 89 with standard deviation of 2. Assume that yield measurements are approximately normally distributed with the same standard deviation. Is there evidence to support a claim that catalyst 2 produces a higher mean yiedl that catalyst 1? Use alpha= 0.01. What is the test statistic?Researchers conducted a study to determine whether magnets are effective in treating back pain. The results are shown for the treatment (with magnets) group and the sham (or placebo) group. Treatment with sample size of 42 and mean of 0.69 and standard deviation of 0.25 Sham with sample size of 44 and mean of 0.75 and standard deviation of 0.44 The results are a measure of reduction in back pain. Assume that the two samples are independent simple random samples selected from normally distributed populations, and do not assume that the population standard deviations are equal. Test the claim that the treatment mean measure of reduction in back pain is greater than the sham mean measure of reduction in back pain. Use the Critical Value Method. Show all the work on paper and enter the critical value with 3-decimal places. show formulas and draw all curves.Two species of pigs have data colllected from them, 13 pigs from group 1 and 24 from group 2. Group one had a breeding period of 11 days with a standard deviation of 3.2 days and group two had a breeding period of 16 days with a standard deviation of 3.8 days. What are the average lengths of the breeding periods between the two groups. make a hypothesis with alpha at 0.01. What is the hypothesis? What is the test statistic? What is the p-value? Decision reached for hypothesis? Final conclusion? (is there significant evidence to suggest a difference between the breeding periods?)
- A soft drink bottler is interested in the smooth operation of the machine used to fill cans. In particular, you want the standard deviation of the filling process to be less than 0.2 fluid ounces; otherwise, there will be a higher than tolerable percentage of cans that will not be completely full.Assume that the fill volume is approximately normally distributed. A random sample of 20 cans results in a variance of S ^ 2 = 0.0225 (ounces) ^ 2. The image shows the creation of a 95% confidence interval Create an upper 95% confidence intervalAUA wants to determine whether the mean cumulative GPA, CGPA is significantly different among undergraduate and graduate students (Sheet 31). They collect data on several undergraduate and graduate students. What can they conclude at alpha=0.05? Select one: a. t(stat)=2.56, which is greater than t(cr)=1.68, therefore, we can conclude that there is significant difference in mean CGPAs b. Assuming unequal variances, t(stat)=2.56, which is greater than t(cr)=2.02, therefore, we can conclude that there is significant difference in mean CGPAs c. t(stat)=1.15, which is less than t(cr)=2.12, therefore, we can conclude that there is no significant difference in mean CGPAs d. Assuming equal variances, t(stat)=2.56, which is greater than t(cr)=2.02, therefore, we can conclude that there is significant difference in mean CGPAs1. A random sample of birth weights of 186 babies has a mean of 3103g and a known standard deviationof 696 g (based on data from “Cognitive Outcomes of Preschool Children with Prenatal Cocaine Exposure,” by Singer et al., Journal of the American Medical Association, Vol. 291, No. 20). These babies were born to mothers who did not use cocaine during their pregnancies. Construct a 93% cofidence interval for the population mean birth weight for all such babies . Use the z distribution since the sigma is know. Choose the correct answer below: [2972, 3234] [3010, 3195]