Using U.S. Energy Information Administration data for selected years from 2010 and projected to 2040, the U.S. real disposable income per capita (in thousands of dollars) can be modeled by I(t) = 32.11(1.014)* where t is the number of years after 2010.
Using U.S. Energy Information Administration data for selected years from 2010 and projected to 2040, the U.S. real disposable income per capita (in thousands of dollars) can be modeled by I(t) = 32.11(1.014)* where t is the number of years after 2010.

Chapter6: Exponential And Logarithmic Functions
Section6.7: Exponential And Logarithmic Models
Problem 16TI: Recent data suggests that, as of 2013, the rate of growth predicted by Moore’s Law no longer holds....

Related questions

Question
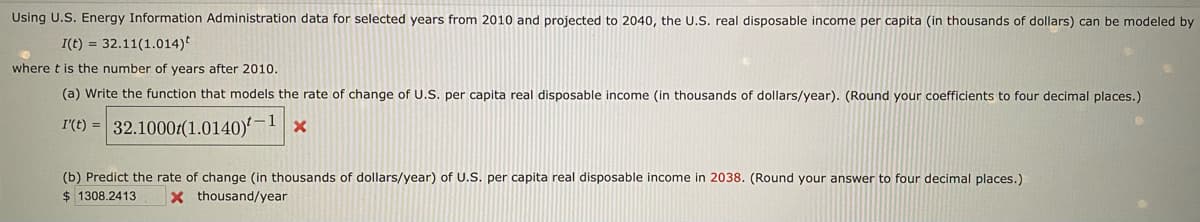
Transcribed Image Text:Using U.S. Energy Information Administration data for selected years from 2010 and projected to 2040, the U.S. real disposable income per capita (in thousands of dollars) can be modeled by
I(t) = 32.11(1.014)*
where t is the number of years after 2010.
(a) Write the function that models the rate of change of U.S. per capita real disposable income (in thousands of dollars/year). (Round your coefficients to four decimal places.)
I'(t) = 32.10001(1.0140)'-1 ×
(b) Predict the rate of change (in thousands of dollars/year) of U.S. per capita real disposable income in 2038. (Round your answer to four decimal places.)
$ 1308.2413
xthousand/year
Expert Solution
This question has been solved!
Explore an expertly crafted, step-by-step solution for a thorough understanding of key concepts.

This is a popular solution!

Trending now
This is a popular solution!

Step by step
Solved in 2 steps with 2 images

Knowledge Booster


Learn more about
Need a deep-dive on the concept behind this application? Look no further. Learn more about this topic, calculus and related others by exploring similar questions and additional content below.Recommended textbooks for you

Algebra & Trigonometry with Analytic Geometry
Algebra
ISBN:
9781133382119
Author:
Swokowski
Publisher:
Cengage

Algebra and Trigonometry (MindTap Course List)
Algebra
ISBN:
9781305071742
Author:
James Stewart, Lothar Redlin, Saleem Watson
Publisher:
Cengage Learning
Algebra & Trigonometry with Analytic Geometry
Algebra
ISBN:
9781133382119
Author:
Swokowski
Publisher:
Cengage
Algebra and Trigonometry (MindTap Course List)
Algebra
ISBN:
9781305071742
Author:
James Stewart, Lothar Redlin, Saleem Watson
Publisher:
Cengage Learning