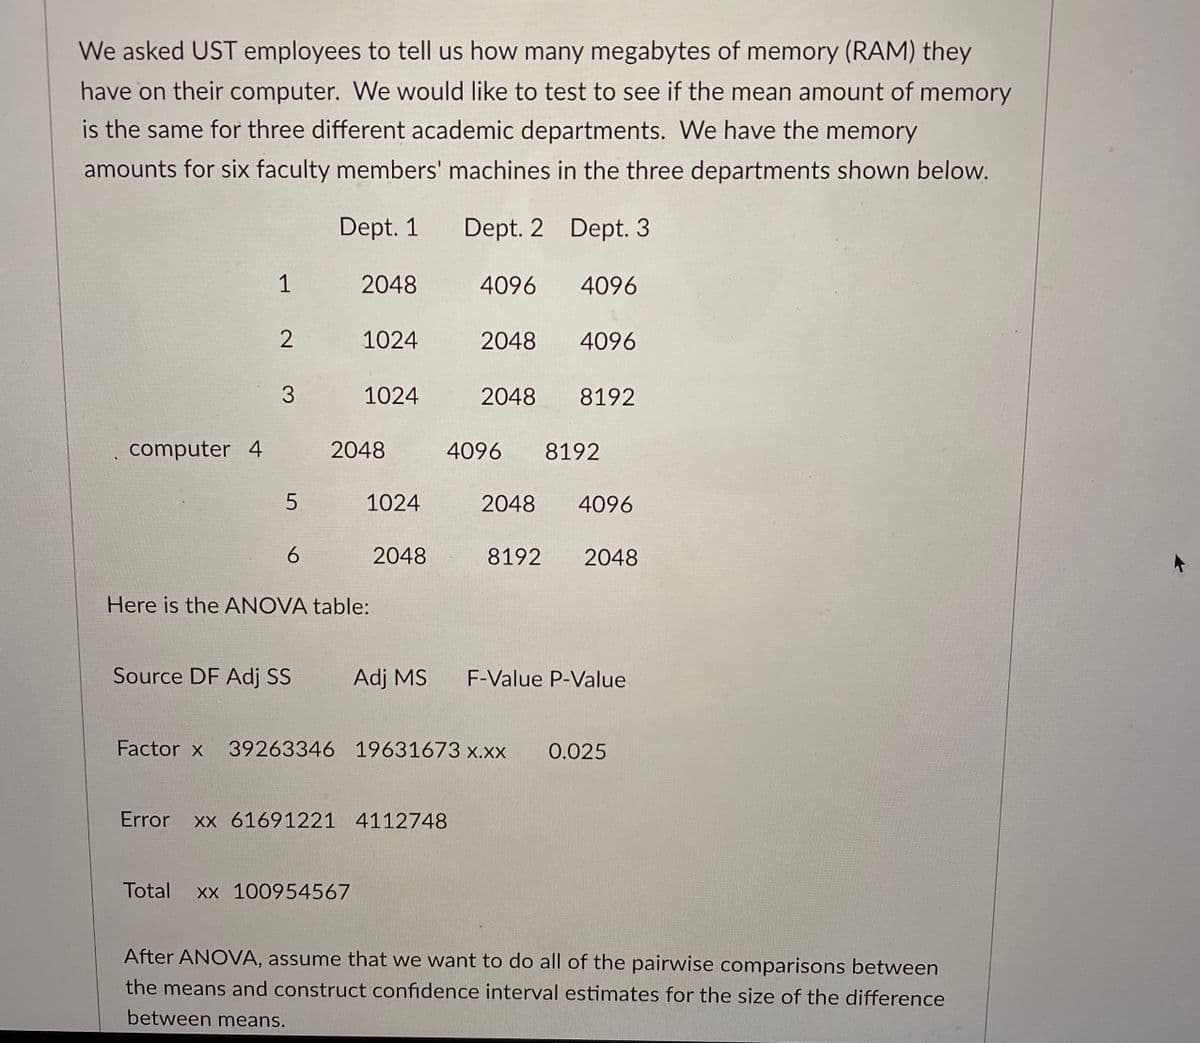
We asked UST employees to tell us how many megabytes of memory (RAM) they have on their computer. We would like to test to see if the mean amount of memory is the same for three different academic departments. We have the memory amounts for six faculty members' machines in the three departments shown below. Dept. 1 Dept. 2 Dept. 3 1 2048 4096 4096 1024 2048 4096 3. 1024 2048 8192
We asked UST employees to tell us how many megabytes of memory (RAM) they have on their computer. We would like to test to see if the mean amount of memory is the same for three different academic departments. We have the memory amounts for six faculty members' machines in the three departments shown below. Dept. 1 Dept. 2 Dept. 3 1 2048 4096 4096 1024 2048 4096 3. 1024 2048 8192

Glencoe Algebra 1, Student Edition, 9780079039897, 0079039898, 2018
18th Edition
ISBN:9780079039897
Author:Carter
Publisher:Carter
Chapter4: Equations Of Linear Functions
Section: Chapter Questions
Problem 8SGR

Related questions
Question
Transcribed Image Text:We asked UST employees to tell us how many megabytes of memory (RAM) they
have on their computer. We would like to test to see if the mean amount of memory
is the same for three different academic departments. We have the memory
amounts for six faculty members' machines in the three departments shown below.
Dept. 1
Dept. 2 Dept. 3
1
2048
4096
4096
1024
2048
4096
1024
2048
8192
computer 4
2048
4096
8192
1024
2048
4096
6.
2048
8192
2048
Here is the ANOVA table:
Source DF Adj SS
Adj MS
F-Value P-Value
Factor x
39263346 19631673 X.XX
0.025
Error
XX 61691221 4112748
Total
XX 100954567
After ANOVA, assume that we want to do all of the pairwise comparisons between
the means and construct confidence interval estimates for the size of the difference
between means.
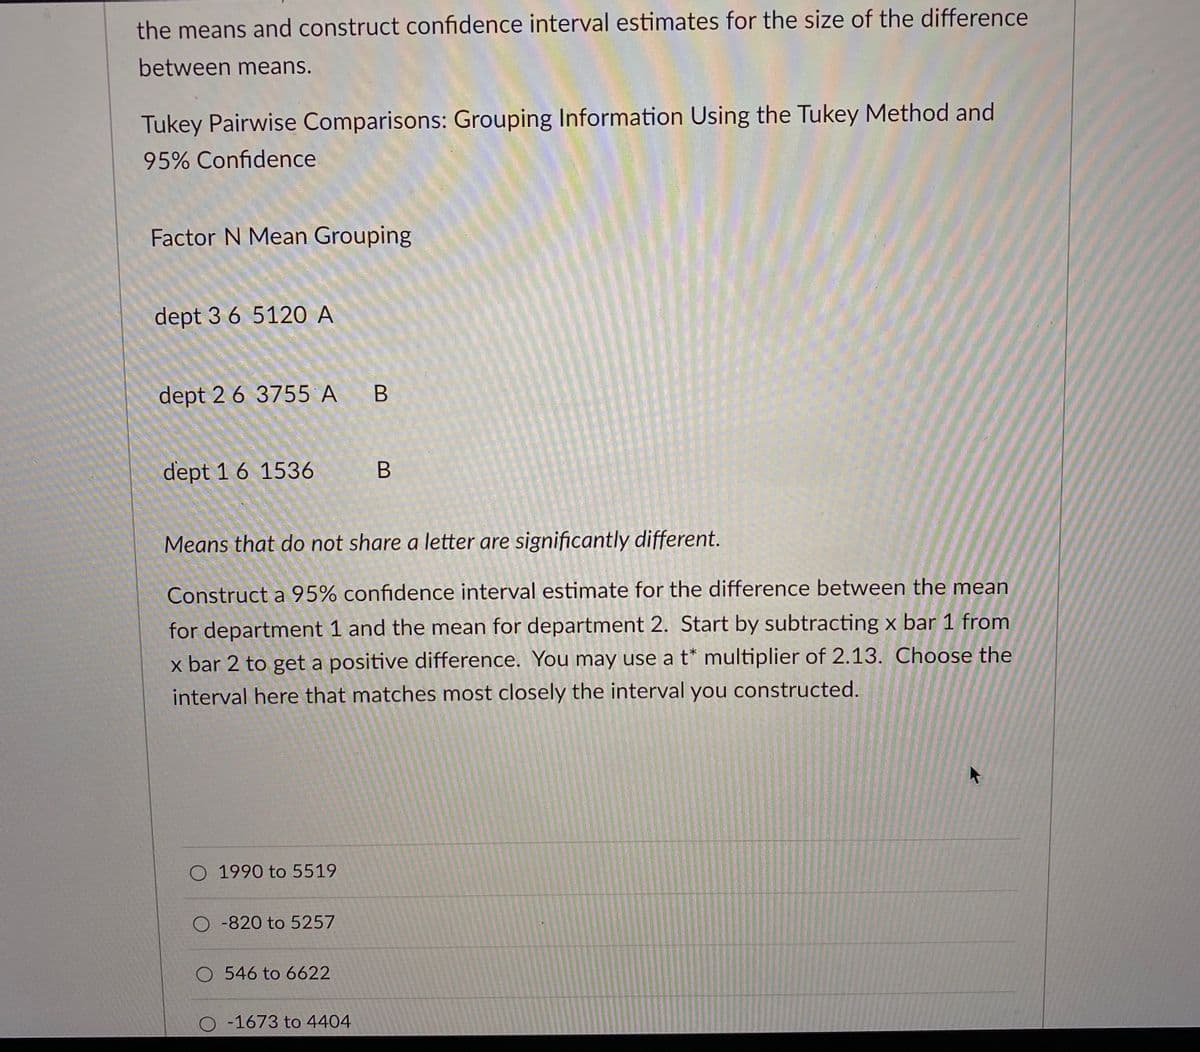
Transcribed Image Text:the means and construct confidence interval estimates for the size of the difference
between means.
Tukey Pairwise Comparisons: Grouping Information Using the Tukey Method and
95% Confidence
Factor N Mean Grouping
dept 3 6 5120 A
dept 2 6 3755 A B
dept 1 6 1536
В
Means that do not share a letter are significantly different.
Construct a 95% confidence interval estimate for the difference between the mean
for department 1 and the mean for department 2. Start by subtracting x bar 1 from
x bar 2 to get a positive difference. You may use a t* multiplier of 2.13. Choose the
interval here that matches most closely the interval you constructed.
O 1990 to 5519
O -820 to 5257
O 546 to 6622
O -1673 to 4404
Expert Solution
This question has been solved!
Explore an expertly crafted, step-by-step solution for a thorough understanding of key concepts.

This is a popular solution!

Trending now
This is a popular solution!

Step by step
Solved in 4 steps with 2 images

Recommended textbooks for you
Glencoe Algebra 1, Student Edition, 9780079039897…
Algebra
ISBN:
9780079039897
Author:
Carter
Publisher:
McGraw Hill
Glencoe Algebra 1, Student Edition, 9780079039897…
Algebra
ISBN:
9780079039897
Author:
Carter
Publisher:
McGraw Hill