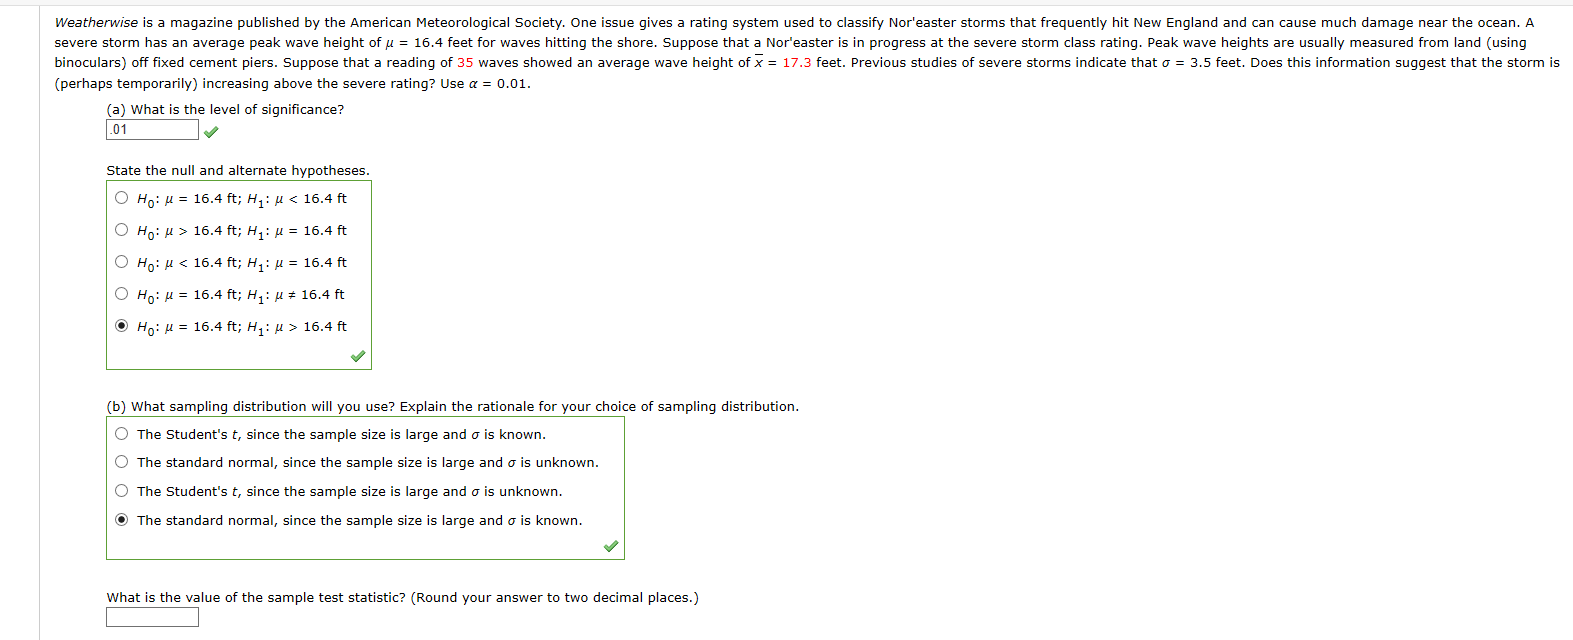
Weotherwise is a magazine published by the American Mctcorological Socicty. One issue gives a rating system used to classify Nor'easter storms that froquently hit New England and can cause much damage near the occan. A severe storm has an average peak wave height of g = 16.4 feet for waves hitting the shore. Suppose that a Nor'easter is in progress at the severe storm class rating. Peak wave heights are usually measured from land (using binoculars) oft tixed cament plers. Suppose that a reading of 35 waves showed an zverage wave height of x- 17.3 foet. Pravlous studies of severe storms indilcate that o- 3.5 foet. Doas this information suggost that the storm is (perhaps tamporarily) Increasing above the severe rating? Usa a - 0.01. (a) What is the levcl of significance? .01 State the null and altarnate hypothesas. O Ho: H - 16.4 t; H < 16.4 t O Ho: H> 10.4 t; H: - 16.4 t O Ho: H 10.4 ft; H: - 10.4 ft O Ho: H - 10.1 ft; H:+ 10.1 t * Ho: H = 10.1 ft; H:> 16.1 ft (b) What sampling distrihutian will you use? Explain the rationale far your chcica of sampling distribution. O The Student's t, since the sample size ls large and o is known. O The standard normal, since the sample size is large and o ls unknown. O The Student's r, since tha sample size is large and o is unknown. * The standard normal, since the sample size is large and o is known. What is the value of the sample test statistic? (Round your answer to two decimal places.)


Unitary Method
The word “unitary” comes from the word “unit”, which means a single and complete entity. In this method, we find the value of a unit product from the given number of products, and then we solve for the other number of products.
Speed, Time, and Distance
Imagine you and 3 of your friends are planning to go to the playground at 6 in the evening. Your house is one mile away from the playground and one of your friends named Jim must start at 5 pm to reach the playground by walk. The other two friends are 3 miles away.
Profit and Loss
The amount earned or lost on the sale of one or more items is referred to as the profit or loss on that item.
Units and Measurements
Measurements and comparisons are the foundation of science and engineering. We, therefore, need rules that tell us how things are measured and compared. For these measurements and comparisons, we perform certain experiments, and we will need the experiments to set up the devices.

Step by step
Solved in 5 steps with 6 images


