-What can you conclude about the nature of vertical acceleration for a freely falling projectile? b-What do changes in velocity vector components tell us about acceleration? What can you conclude about the nature of the horizontal acceleration of this ball
-What can you conclude about the nature of vertical acceleration for a freely falling projectile? b-What do changes in velocity vector components tell us about acceleration? What can you conclude about the nature of the horizontal acceleration of this ball

Related questions
Question
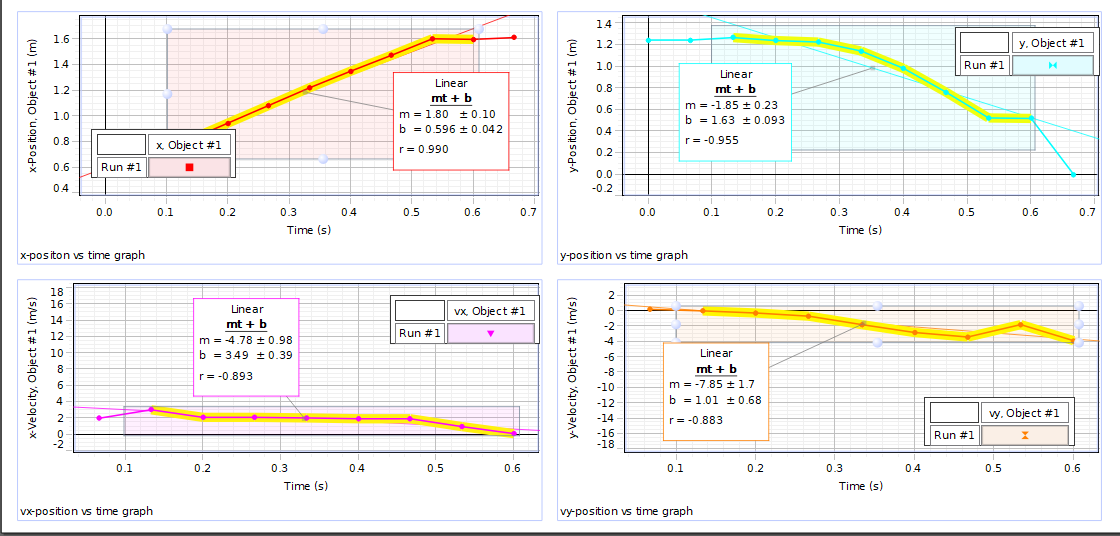
Given the following projectile motion experiment and graphs:
a-What can you conclude about the nature of vertical acceleration for a freely falling projectile?
b-What do changes in velocity vector components tell us about acceleration? What can you conclude about the nature of the horizontal acceleration of this ball
Transcribed Image Text:14
1.6
1.2-
y. Object #1
14
1.0
Run #1
Linear
Linear
0.8
1.2
mt + b
mt + b
m = -1.85 ± 0.23
b = 1.63 +0.093
0.6
1.0
m = 1.80 ± 0.10
b = 0.596 ± 0.042
04
0.8-
r= -0,955
x Object #1
r= 0.990
0.2
0.6
Run #1
0.0
04
-0.2
0.0
0.1
0.2
0.3
04
0.5
0.6
0.7
0.0
0.1
0.2
0.3
04
0.5
0.6
0.7
Time (s)
Time (s)
x-pos iton vs time graph
y-pos ition vs time graph
18
16
2-
Linear
vx Object #1
14
mt + b
m = -4.78 + 0.98
b = 349 ± 0.39
-2
12
Run #1
-4
10
Linear
-6
8.
-8
mt + b
r= -0.893
6
-10
m = -7.85 ±1.7
4
-12
b = 1.01 ±0.68
2
vy. Object #1
-14
r= -0.883
-16
-18
Run #1
0.1
0.2
0.2
0.3
04
0.5
0.6
0.1
0.2
0.2
0.3
04
0.5
0.6
Time (s)
Time (s)
vx-position vs time graph
vy-position vs time graph
x-Velocity, Object #1 (m/s)
x-Pos ition, Object #1 (m)
y-Velocity, Object #1 (m/s)
y-Position, Object #1 (m)
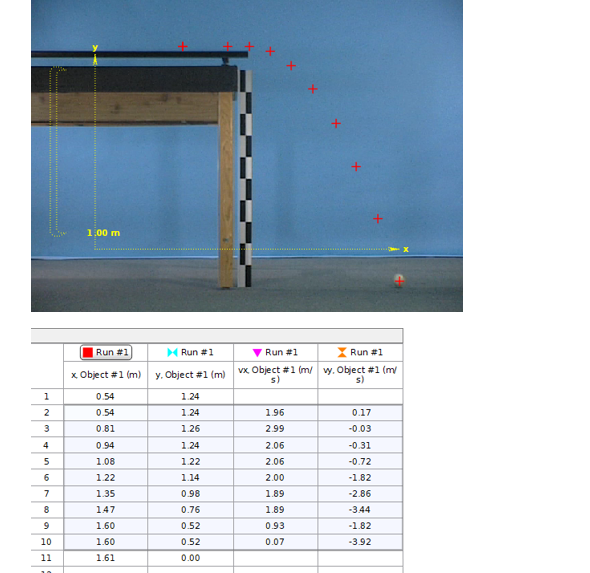
Transcribed Image Text:1.00 m
Run #1
M Run #1
V Run #1
X Run #1
x Object #1 (m)
y. Object #1 (m)
vx Object #1 (m/ vy. Object #1 (m/
1
0.54
1.24
2
0.54
1.24
1.96
0.17
3
0.81
1.26
2.99
-0.03
4
0.94
1.24
2.06
-0.31
5
1.08
1.22
2.06
-0.72
1.22
1.14
2.00
-1.82
7
1.35
0.98
1.89
-2.86
8
147
0.76
1.89
-3.44
1.60
0.52
0.93
-1.82
10
1.60
0.52
0.07
-3.92
11
1.61
0.00
Expert Solution
This question has been solved!
Explore an expertly crafted, step-by-step solution for a thorough understanding of key concepts.

This is a popular solution!

Trending now
This is a popular solution!

Step by step
Solved in 2 steps
