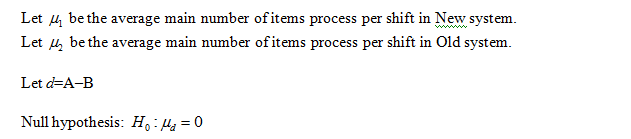
What is the level of significance? State the Null and alternative hypotheses. Will you use a left field, right tailed, or two tailed test? Identify the sampling distribution you were used and explain the rationale for your choice what is the value of the sample test statistic? Find or estimate the P value. Will you reject or fail to reject the null hypothesis? State your conclusion in the context of the application. A system specialist has studied the workflow of clerks all doing the same inventory work. Based on the study, she designed a new workflow layout for the inventory system. To compare average product for the old and new methods, a random sample of six clerks was used. The average production rate ( Number of inventory items process per shift) For each clerk was measured both before and after the new system is introduced. The results are shown below. Test the claim that our new system increases the main number of items process per shift. Assume that both distributions or mound shape and symmetric. Use level of significance equals .05. Clerk 1 2 3 4 5 6 B: Old 116 108 93 88 119 111 A: New 123 114 112 82 127 122


What is the level of significance? State the Null and alternative hypotheses. Will you use a left field, right tailed, or two tailed test? Identify the sampling distribution you were used and explain the rationale for your choice what is the value of the sample test statistic? Find or estimate the P value. Will you reject or fail to reject the null hypothesis? State your conclusion in the context of the application. A system specialist has studied the workflow of clerks all doing the same inventory work. Based on the study, she designed a new workflow layout for the inventory system. To compare average product for the old and new methods, a random sample of six clerks was used. The average production rate ( Number of inventory items process per shift) For each clerk was measured both before and after the new system is introduced. The results are shown below. Test the claim that our new system increases the main number of items process per shift. Assume that both distributions or mound shape and symmetric. Use level of significance equals .05.
| Clerk | 1 | 2 | 3 | 4 | 5 | 6 |
| B: Old | 116 | 108 | 93 | 88 | 119 | 111 |
| A: New | 123 | 114 | 112 | 82 | 127 | 122 |
Determine the level of significance.
Significance level:
In order to decide how small the p-value should be for providing convincing evidence against the null hypothesis, a value should be used. The value that is used as the rule or the criterion for deciding how small the p-value should be is called as level of significance.

State the hypotheses.
That is, there is no evidence that the new system increases the main number of items process per shift.

That is, there is evidence that the new system increases the main number of items process per shift
Determine the tail of the test used.
Since, given that the claim is our new system increases the main number of items process per shift. Here, the word “increases” clearly it is right tailed test.
Identify the type of sampling distribution used.
The type of sampling distribution used here is t distribution because the claim is tested to know about the paired differences between the mean.
Thus, the type of sampling distribution used here is t distribution,
Use Excel to obtain the value of test statistic.
The value of the test statistic is obtained below:
Follow the instruction to obtain the value of test statistic:
- Go to EXCEL
- Go to Data>Data Analysis.
- Choose t-test: Paired Two Samples for Means.
- Enter the range for variable 1 as $A$1:$A$7.
- Enter the range for variable 2 as $B$1:$B$7.
- Check the option Labels in First row.
- Enter the alpha level as 0.05.
- Click OK.
EXCEL output:
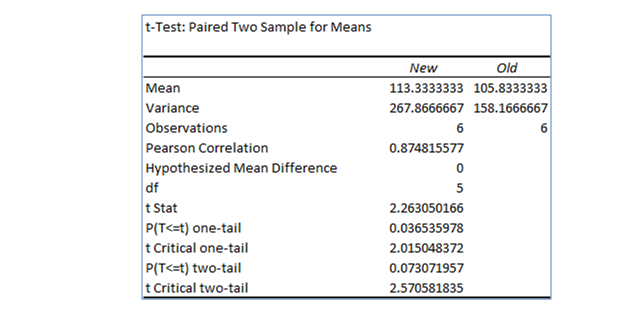
From the EXCEL output, the value of test statistic(t) is 2.26.

Step by step
Solved in 3 steps with 5 images


