What is your conclusion (interpretation) from frequency distribution tables and graphs for the students?
What is your conclusion (interpretation) from frequency distribution tables and graphs for the students?

Algebra & Trigonometry with Analytic Geometry
13th Edition
ISBN:9781133382119
Author:Swokowski
Publisher:Swokowski
Chapter10: Sequences, Series, And Probability
Section10.6: Permutations
Problem 1E

Related questions
Question
100%
What is your conclusion (interpretation) from frequency distribution tables and graphs for the students?
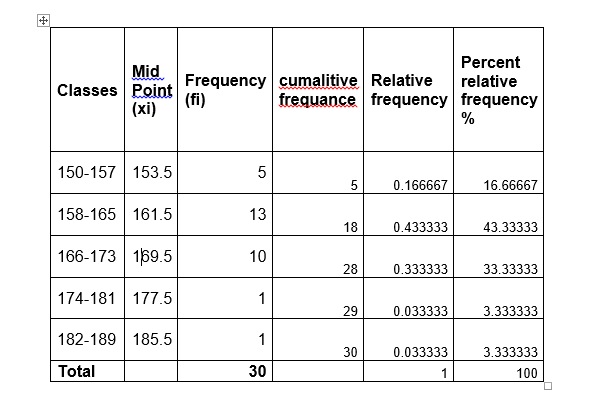
Transcribed Image Text:Percent
Mid
Frequency cumalitive Relative
relative
Classes Point
(fi)
(xi)
frequance frequency frequency
%
150-157 153.5
5
0.166667
16.66667
158-165 | 161.5
13
18
0.433333
43.33333
166-173 169.5
10
28
0.333333
33.33333
174-181 177.5
1
29
0.033333
3.333333
182-189 185.5
1
30
0.033333
3.333333
Total
30
1
100
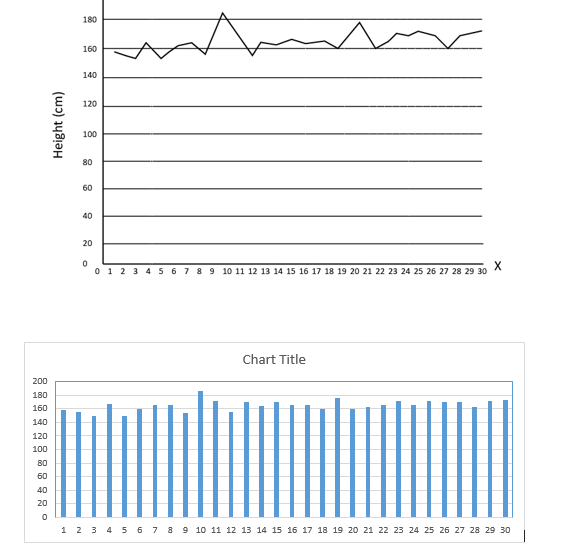
Transcribed Image Text:180
160
140
120
100
80
60
40
20
X
0 1 2 3 4 5 6 7 8 9 10 11 12 13 14 15 16 17 18 19 20 21 22 23 24 25 26 27 28 29 30
Chart Title
200
180
160
140
120
100
B0
60
40
20
1 2 3 4 5 67 8 9 10 11 12 13 14 15 16 17 18 19 20 21 22 23 24 25 26 27 28 29 30
Height (cm)
Expert Solution
Step 1
Answer:
Given frequency distribution table

This tables given that the range of students height's (cm)
The frequency columns refers to how often something occurs.
Here frequency columns refers to find how many student are belong to that height range.
Cumulative frequency is used to determine the number of observation that lie above or below a particular value in a data set. we calculate the cumulative frequency by adding frequencies
The relative frequency is the number of student occurs in that range divided by the total number of student.

Step by step
Solved in 2 steps with 2 images

Knowledge Booster


Learn more about
Need a deep-dive on the concept behind this application? Look no further. Learn more about this topic, probability and related others by exploring similar questions and additional content below.Recommended textbooks for you
Algebra & Trigonometry with Analytic Geometry
Algebra
ISBN:
9781133382119
Author:
Swokowski
Publisher:
Cengage

Mathematics For Machine Technology
Advanced Math
ISBN:
9781337798310
Author:
Peterson, John.
Publisher:
Cengage Learning,
Algebra & Trigonometry with Analytic Geometry
Algebra
ISBN:
9781133382119
Author:
Swokowski
Publisher:
Cengage
Mathematics For Machine Technology
Advanced Math
ISBN:
9781337798310
Author:
Peterson, John.
Publisher:
Cengage Learning,