What is your conclusion (interpretation) from frequency distribution tables and graphs for the students?
What is your conclusion (interpretation) from frequency distribution tables and graphs for the students?

Algebra: Structure And Method, Book 1
(REV)00th Edition
ISBN:9780395977224
Author:Richard G. Brown, Mary P. Dolciani, Robert H. Sorgenfrey, William L. Cole
Publisher:Richard G. Brown, Mary P. Dolciani, Robert H. Sorgenfrey, William L. Cole
Chapter10: Inequalities
Section10.4: Solving Combined Inequalities
Problem 3WE

Related questions
Question
100%
What is your conclusion (interpretation) from frequency distribution tables and graphs for the
students?
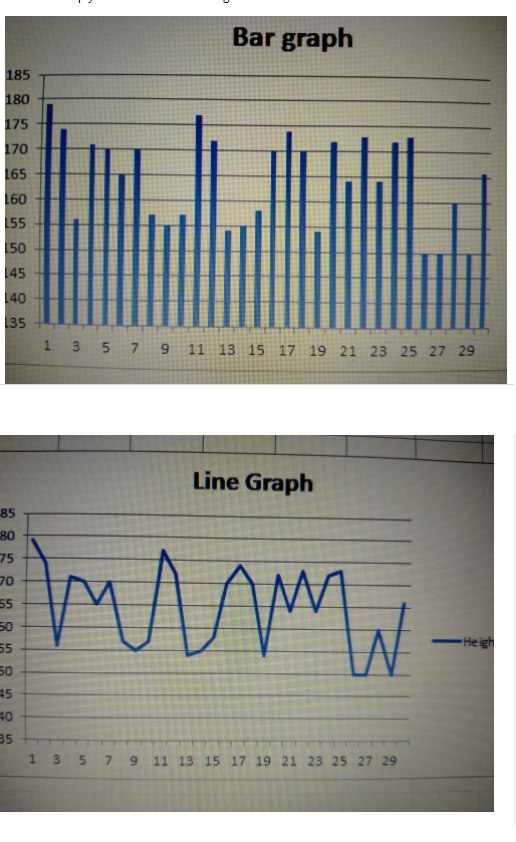
Transcribed Image Text:Bar graph
185
180
175
170
165
160
155
150
145
40
135
1 3 57 9 11 13 15 17 19 21 23 25 27 29
Line Graph
85
80
75
70
55
50
55
50
45
Heigh
40
35
1.
9.
11 13 15 17 19 21 23 25 27 29
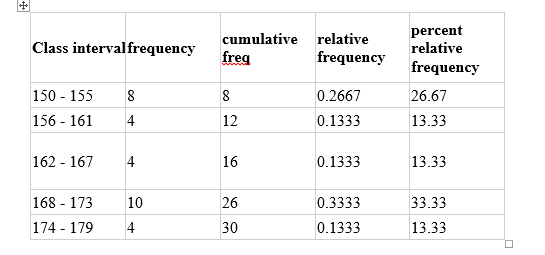
Transcribed Image Text:percent
relative
cumulative relative
Class intervalfrequency
freg
frequency
frequency
150 - 155
8
8
0.2667
26.67
156 - 161
4
12
0.1333
13.33
162 - 167
4
16
0.1333
13.33
168 - 173
10
26
0.3333
33.33
174 - 179
4
30
0.1333
13.33
中
Expert Solution
This question has been solved!
Explore an expertly crafted, step-by-step solution for a thorough understanding of key concepts.

Step by step
Solved in 2 steps

Knowledge Booster


Learn more about
Need a deep-dive on the concept behind this application? Look no further. Learn more about this topic, statistics and related others by exploring similar questions and additional content below.Recommended textbooks for you
Algebra: Structure And Method, Book 1
Algebra
ISBN:
9780395977224
Author:
Richard G. Brown, Mary P. Dolciani, Robert H. Sorgenfrey, William L. Cole
Publisher:
McDougal Littell
Algebra: Structure And Method, Book 1
Algebra
ISBN:
9780395977224
Author:
Richard G. Brown, Mary P. Dolciani, Robert H. Sorgenfrey, William L. Cole
Publisher:
McDougal Littell