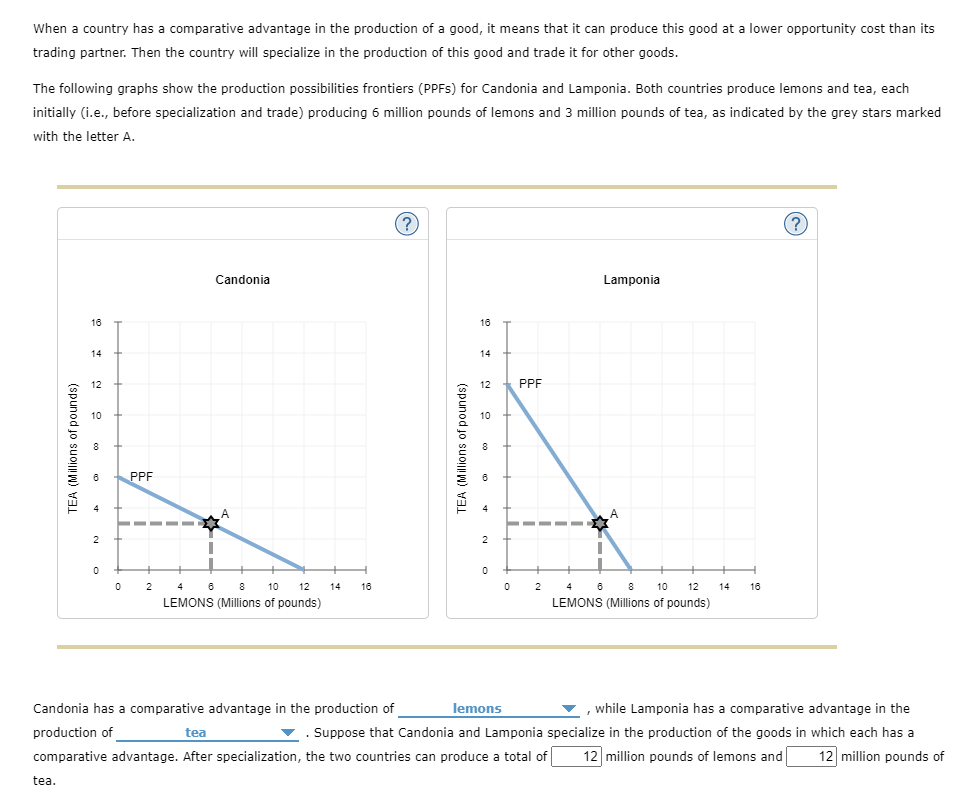
When a country has a comparative advantage in the production of a good, it means that it can produce this good at a lower opportunity cost than its trading partner. Then the country will specialize in the production of this good and trade it for other goods. The following graphs show the production possibilities frontiers (PPFS) for Candonia and Lamponia. Both countries produce lemons and tea, each initially (i.e., before specialization and trade) producing 6 million pounds of lemons and 3 million pounds of tea, as indicated by the grey stars marked with the letter A. Candonia Lamponia 16 18 14 14 12 12 PPF 10 10 PPF 8 10 12 14 LEMONS (Millions of pounds) 4 0 8 10 12 LEMONS (Millions of pounds) 2 18 2 14 18 while Lamponia has a comparative advantage in the . Suppose that Candonia and Lamponia specialize in the production of the goods in which each has a Candonia has a comparative advantage in the production of lemons production of tea comparative advantage. After specialization, the two countries can produce a total of 12 million pounds of lemons and 12 million pounds of tea. co 2. TEA (Millions of pounds) co TEA (Millions of pounds)
When a country has a comparative advantage in the production of a good, it means that it can produce this good at a lower opportunity cost than its trading partner. Then the country will specialize in the production of this good and trade it for other goods. The following graphs show the production possibilities frontiers (PPFS) for Candonia and Lamponia. Both countries produce lemons and tea, each initially (i.e., before specialization and trade) producing 6 million pounds of lemons and 3 million pounds of tea, as indicated by the grey stars marked with the letter A. Candonia Lamponia 16 18 14 14 12 12 PPF 10 10 PPF 8 10 12 14 LEMONS (Millions of pounds) 4 0 8 10 12 LEMONS (Millions of pounds) 2 18 2 14 18 while Lamponia has a comparative advantage in the . Suppose that Candonia and Lamponia specialize in the production of the goods in which each has a Candonia has a comparative advantage in the production of lemons production of tea comparative advantage. After specialization, the two countries can produce a total of 12 million pounds of lemons and 12 million pounds of tea. co 2. TEA (Millions of pounds) co TEA (Millions of pounds)

Microeconomics A Contemporary Intro
10th Edition
ISBN:9781285635101
Author:MCEACHERN
Publisher:MCEACHERN
Chapter19: International Trade
Section: Chapter Questions
Problem 3QFR

Related questions
Question
100%
the attached econ28, can you double check to see if the answer is correct.
Next, on the attached econ29, can you help me place where the symbol goes on each graph
Transcribed Image Text:When a country has a comparative advantage in the production of a good, it means that it can produce this good at a lower opportunity cost than its
trading partner. Then the country will specialize in the production of this good and trade it for other goods.
The following graphs show the production possibilities frontiers (PPFS) for Candonia and Lamponia. Both countries produce lemons and tea, each
initially (i.e., before specialization and trade) producing 6 million pounds of lemons and 3 million pounds of tea, as indicated by the grey stars marked
with the letter A.
Candonia
Lamponia
16
16
14
14
12
PPF
PPF
A.
2
4
8
10
12
14
16
2
4
8
10
12
14
16
LEMONS (Millions of pounds)
LEMONS (Millions of pounds)
Candonia has a comparative advantage in the production of
lemons
while Lamponia has a comparative advantage in the
production of
tea
. Suppose that Candonia and Lamponia specialize in the production of the goods in which each has a
comparative advantage. After specialization, the two countries can produce a total of
12 million pounds of lemons and
12 million pounds of
tea.
EA (Millions of pounds)
(spunod jo SUQULM) va
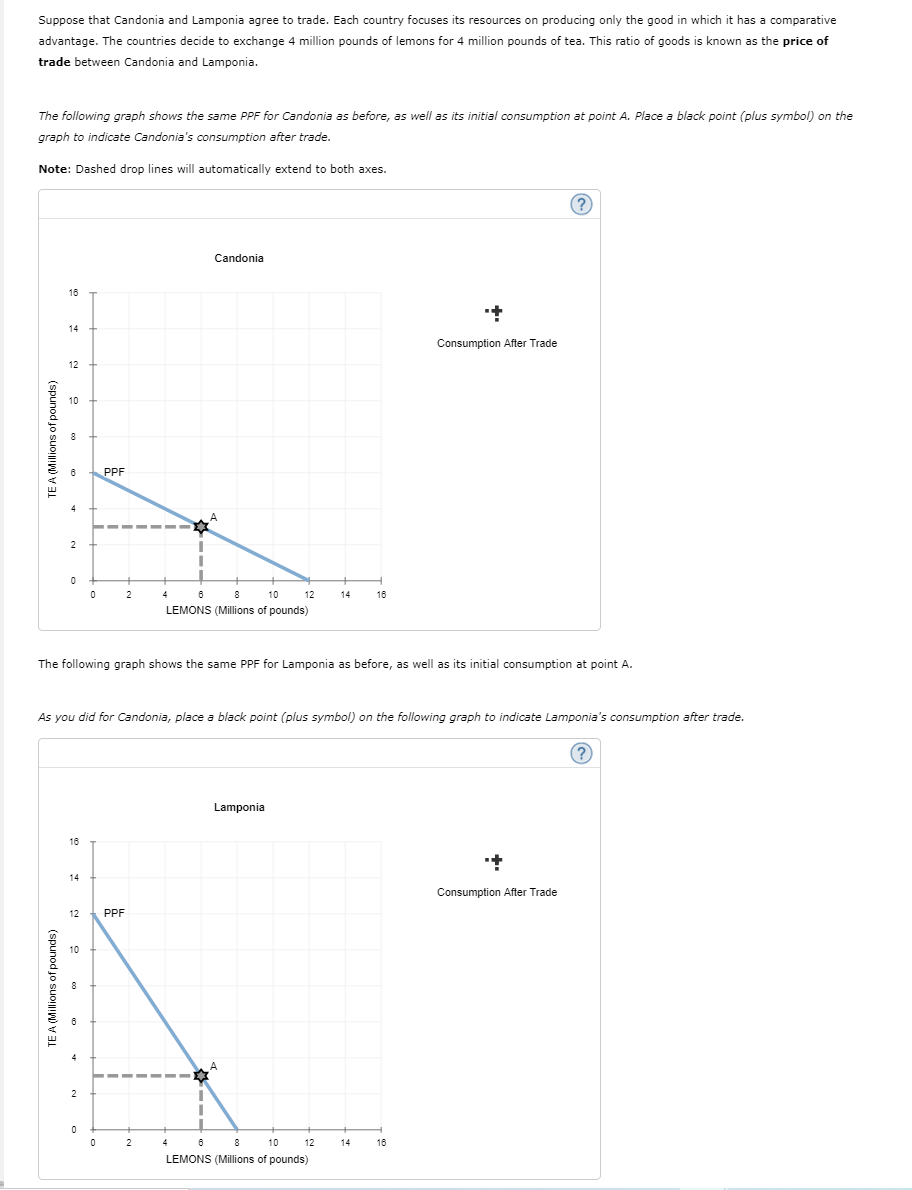
Transcribed Image Text:Suppose that Candonia and Lamponia agree to trade. Each country focuses its resources on producing only the good in which it has a comparative
advantage. The countries decide to exchange 4 million pounds of lemons for 4 million pounds of tea. This ratio of goods is known as the price of
trade between Candonia and Lamponia.
The following graph shows the same PPF for Candonia as before, as well as its initial consumption at point A. Place a black point (plus symbol) on the
graph to indicate Candonia's consumption after trade.
Note: Dashed drop lines will automatically extend to both axes.
?
Candonia
16
14
Consumption After Trade
12
10
PPF
2
2
6
4
8
10
12
14
16
LEMONS (Millions of pounds)
The following graph shows the same PPF for Lamponia as before, as well as its initial consumption at point A.
As you did for Candonia, place a black point (plus symbol) on the following graph to indicate Lamponia's consumption after trade.
(?
Lamponia
16
14
Consumption After Trade
12
PPF
10
2
2
8
10
12
14
16
LEMONS (Millions of pounds)
TE A (Millions of pounds)
TE A (Millions of pounds)
Expert Solution
This question has been solved!
Explore an expertly crafted, step-by-step solution for a thorough understanding of key concepts.

This is a popular solution!

Trending now
This is a popular solution!

Step by step
Solved in 4 steps with 3 images

Knowledge Booster


Learn more about
Need a deep-dive on the concept behind this application? Look no further. Learn more about this topic, economics and related others by exploring similar questions and additional content below.Recommended textbooks for you


Economics (MindTap Course List)
Economics
ISBN:
9781337617383
Author:
Roger A. Arnold
Publisher:
Cengage Learning