When members of a philanthropic organization send out a fundraising letter, they get a return from about 5% of the people on their mailing list. They simulated 1000 mailings for samples of size n with success rate p= 0.05. The sample statistics from each simulation are shown in the table. Complete parts a) through c). n mean standard dev. 20 0 0501 0.0485 50 100 200 0.0508 0.0504 0.0307 0.0214 0.0156 0.0501 a) According to the central limit theorem, what should the theoretical mean and standard deviation be for each of the sample sizes? Complete the following table. theoretical mean theoretical standard dev. 20 50 100 200 (Round to four decimal places as needed.) b) How close are the theoretical values to those that were observed? O Not close O Very close
When members of a philanthropic organization send out a fundraising letter, they get a return from about 5% of the people on their mailing list. They simulated 1000 mailings for samples of size n with success rate p= 0.05. The sample statistics from each simulation are shown in the table. Complete parts a) through c). n mean standard dev. 20 0 0501 0.0485 50 100 200 0.0508 0.0504 0.0307 0.0214 0.0156 0.0501 a) According to the central limit theorem, what should the theoretical mean and standard deviation be for each of the sample sizes? Complete the following table. theoretical mean theoretical standard dev. 20 50 100 200 (Round to four decimal places as needed.) b) How close are the theoretical values to those that were observed? O Not close O Very close

College Algebra (MindTap Course List)
12th Edition
ISBN:9781305652231
Author:R. David Gustafson, Jeff Hughes
Publisher:R. David Gustafson, Jeff Hughes
Chapter8: Sequences, Series, And Probability
Section8.7: Probability
Problem 5E: List the sample space of each experiment. Rolling one die and tossing one coin

Related questions

Concept explainers
Contingency Table
A contingency table can be defined as the visual representation of the relationship between two or more categorical variables that can be evaluated and registered. It is a categorical version of the scatterplot, which is used to investigate the linear relationship between two variables. A contingency table is indeed a type of frequency distribution table that displays two variables at the same time.
Binomial Distribution
Binomial is an algebraic expression of the sum or the difference of two terms. Before knowing about binomial distribution, we must know about the binomial theorem.
Topic Video
Question
7
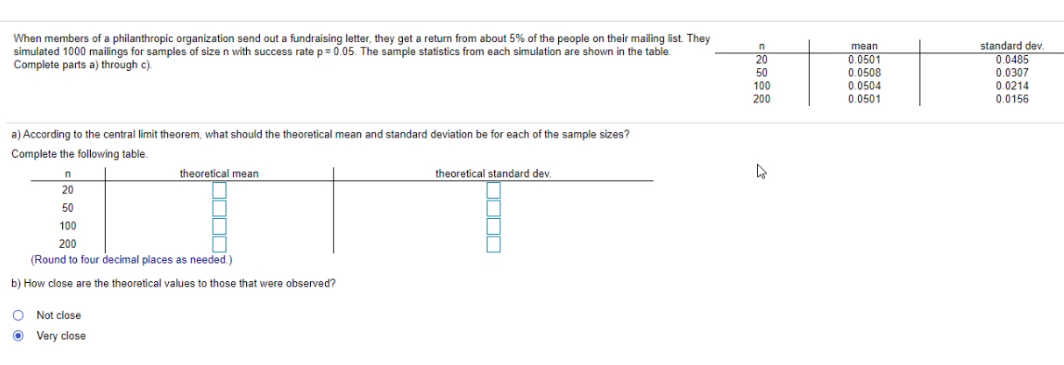
Transcribed Image Text:When members of a philanthropic organization send out a fundraising letter, they get a return from about 5% of the people on their mailing list. They
simulated 1000 mailings for samples of size n with success rate p= 0.05. The sample statistics from each simulation are shown in the table.
Complete parts a) through c).
standard dev.
0.0485
0.0307
0.0214
0.0156
mean
50
100
200
0.0501
0.0508
0.0504
0.0501
a) According to the central limit theorem, what should the theoretical mean and standard deviation be for each of the sample sizes?
Complete the following table.
theoretical mean
theoretical standard dev.
20
50
100
200
(Round to four decimal places as needed.)
b) How close are the theoretical values to those that were observed?
Not close
O Very close
Expert Solution
This question has been solved!
Explore an expertly crafted, step-by-step solution for a thorough understanding of key concepts.

This is a popular solution!

Trending now
This is a popular solution!

Step by step
Solved in 3 steps

Knowledge Booster


Learn more about
Need a deep-dive on the concept behind this application? Look no further. Learn more about this topic, statistics and related others by exploring similar questions and additional content below.Recommended textbooks for you
College Algebra (MindTap Course List)
Algebra
ISBN:
9781305652231
Author:
R. David Gustafson, Jeff Hughes
Publisher:
Cengage Learning

Glencoe Algebra 1, Student Edition, 9780079039897…
Algebra
ISBN:
9780079039897
Author:
Carter
Publisher:
McGraw Hill
College Algebra (MindTap Course List)
Algebra
ISBN:
9781305652231
Author:
R. David Gustafson, Jeff Hughes
Publisher:
Cengage Learning
Glencoe Algebra 1, Student Edition, 9780079039897…
Algebra
ISBN:
9780079039897
Author:
Carter
Publisher:
McGraw Hill