When should I use the Paired t-test? Remember that some tests, such as chi squared, can be used under various circumstances. The goal of the test changes based on the situation. Pay attention to the specific conditions noted in parenthesis to ensure you are picking the correct goal. A. Compares numerical data to a known mean. The nullI hypothesis is that the mean of the data equals the known mean. B. Test the fit of the normal distribution to the data set. C. Test to compare frequency data to a specific population model D. Compare two treatment groups of independent samples where the data meet the assumption that the data fit the normal distribution. E. Compare more than two treatment groups when a normal distribution cannot be met. F. Compare two treatment groups consisting of independent samples with a normal distribution AND unequal variance. G. Compare two treatments consisting of paired data where a normal distribution can be assumed. H. Compare two treatment groups consisting of paired data when the data do not fit the normal distribution. I. Test to see if the frequency data from a population fit a discrete probability distribution. J. Compare categorical frequency data with an expected population proportion. No difference between observed and expected proportions is used as the null hypothesis. K. Compare two treatment groups when a normal distribution cannot be assumed. L. More than two treatment groups where a normal distribution can be assumed. M. Test if the median of a data set equals a null hypothesized value when the distribution of the data does not meet the assumption of normalacy.
When should I use the Paired t-test? Remember that some tests, such as chi squared, can be used under various circumstances. The goal of the test changes based on the situation. Pay attention to the specific conditions noted in parenthesis to ensure you are picking the correct goal. A. Compares numerical data to a known mean. The nullI hypothesis is that the mean of the data equals the known mean. B. Test the fit of the normal distribution to the data set. C. Test to compare frequency data to a specific population model D. Compare two treatment groups of independent samples where the data meet the assumption that the data fit the normal distribution. E. Compare more than two treatment groups when a normal distribution cannot be met. F. Compare two treatment groups consisting of independent samples with a normal distribution AND unequal variance. G. Compare two treatments consisting of paired data where a normal distribution can be assumed. H. Compare two treatment groups consisting of paired data when the data do not fit the normal distribution. I. Test to see if the frequency data from a population fit a discrete probability distribution. J. Compare categorical frequency data with an expected population proportion. No difference between observed and expected proportions is used as the null hypothesis. K. Compare two treatment groups when a normal distribution cannot be assumed. L. More than two treatment groups where a normal distribution can be assumed. M. Test if the median of a data set equals a null hypothesized value when the distribution of the data does not meet the assumption of normalacy.

MATLAB: An Introduction with Applications
6th Edition
ISBN:9781119256830
Author:Amos Gilat
Publisher:Amos Gilat
Chapter1: Starting With Matlab
Section: Chapter Questions
Problem 1P

Related questions
Question
please highlight the correct answer
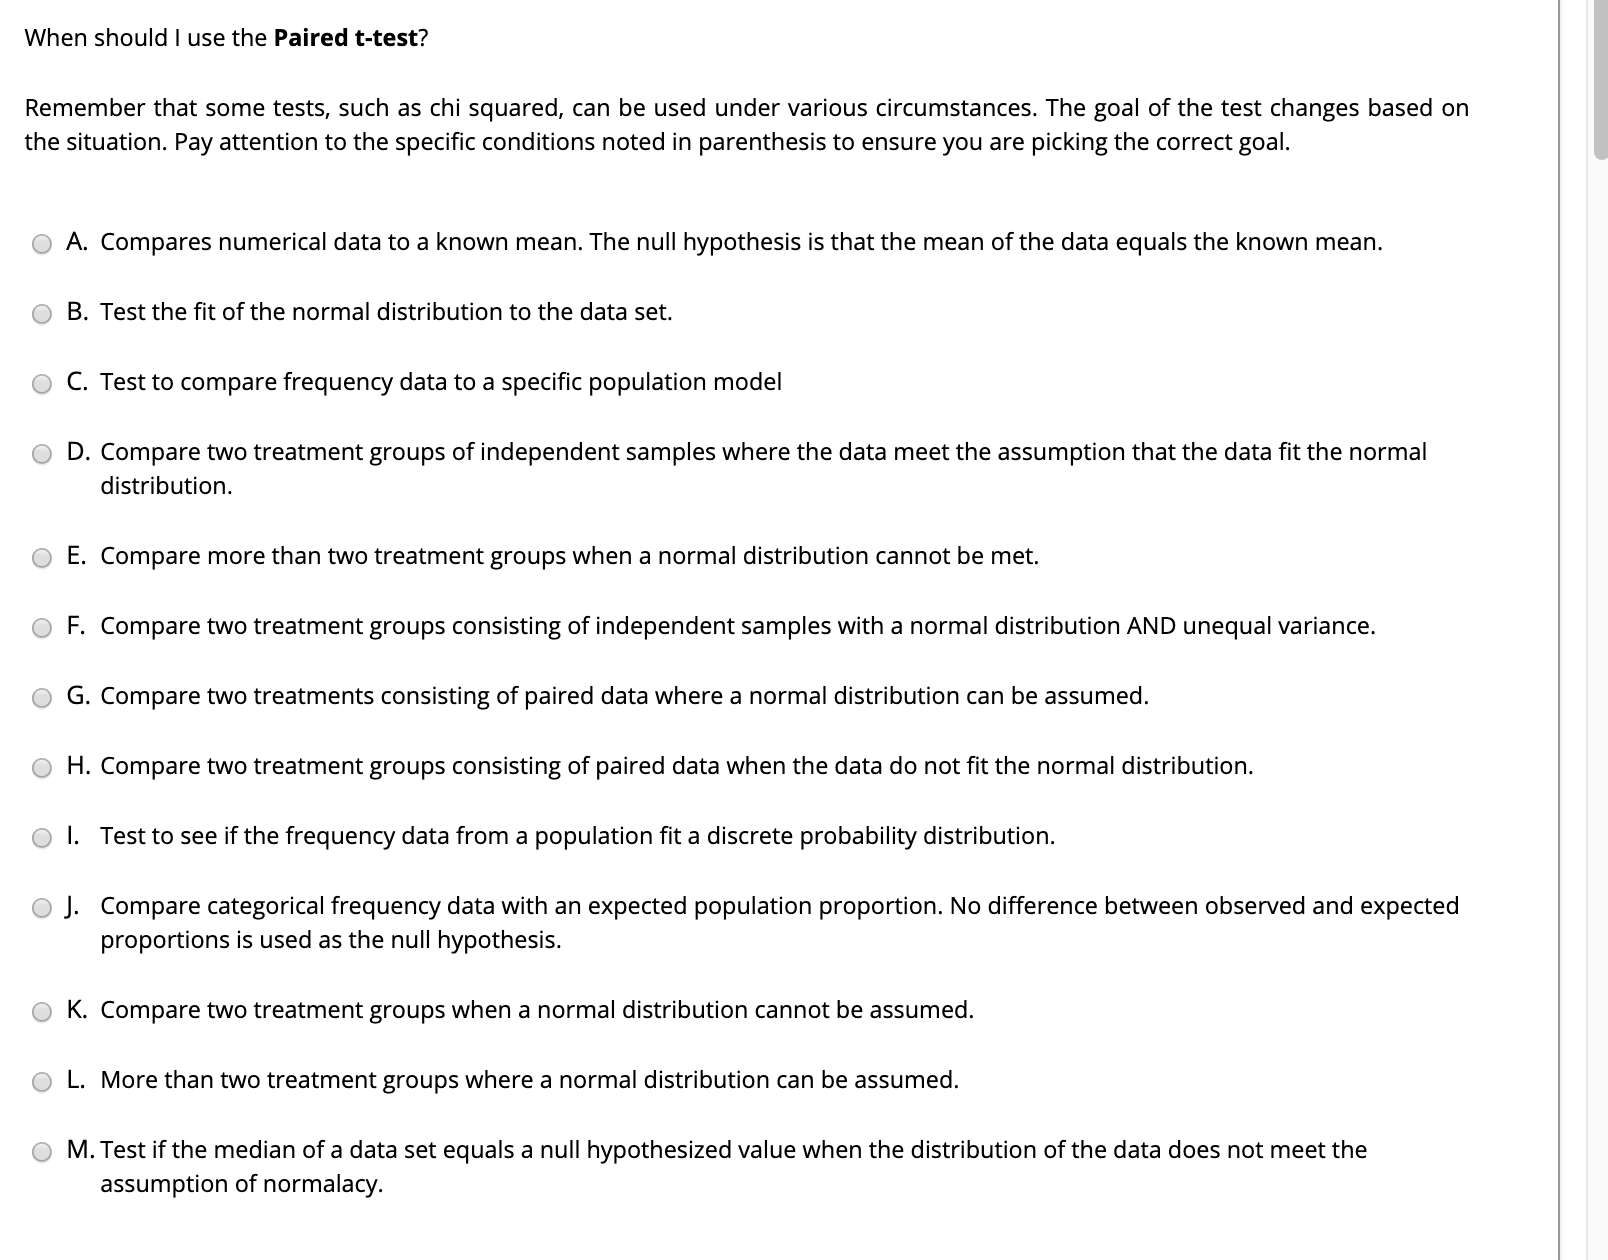
Transcribed Image Text:When should I use the Paired t-test?
Remember that some tests, such as chi squared, can be used under various circumstances. The goal of the test changes based on
the situation. Pay attention to the specific conditions noted in parenthesis to ensure you are picking the correct goal.
A. Compares numerical data to a known mean. The nullI hypothesis is that the mean of the data equals the known mean.
B. Test the fit of the normal distribution to the data set.
C. Test to compare frequency data to a specific population model
D. Compare two treatment groups of independent samples where the data meet the assumption that the data fit the normal
distribution.
E. Compare more than two treatment groups when a normal distribution cannot be met.
F. Compare two treatment groups consisting of independent samples with a normal distribution AND unequal variance.
G. Compare two treatments consisting of paired data where a normal distribution can be assumed.
H. Compare two treatment groups consisting of paired data when the data do not fit the normal distribution.
I. Test to see if the frequency data from a population fit a discrete probability distribution.
J. Compare categorical frequency data with an expected population proportion. No difference between observed and expected
proportions is used as the null hypothesis.
K. Compare two treatment groups when a normal distribution cannot be assumed.
L. More than two treatment groups where a normal distribution can be assumed.
M. Test if the median of a data set equals a null hypothesized value when the distribution of the data does not meet the
assumption of normalacy.
Expert Solution
This question has been solved!
Explore an expertly crafted, step-by-step solution for a thorough understanding of key concepts.

This is a popular solution!

Trending now
This is a popular solution!

Step by step
Solved in 2 steps

Knowledge Booster


Learn more about
Need a deep-dive on the concept behind this application? Look no further. Learn more about this topic, statistics and related others by exploring similar questions and additional content below.Recommended textbooks for you
MATLAB: An Introduction with Applications
Statistics
ISBN:
9781119256830
Author:
Amos Gilat
Publisher:
John Wiley & Sons Inc

Probability and Statistics for Engineering and th…
Statistics
ISBN:
9781305251809
Author:
Jay L. Devore
Publisher:
Cengage Learning

Statistics for The Behavioral Sciences (MindTap C…
Statistics
ISBN:
9781305504912
Author:
Frederick J Gravetter, Larry B. Wallnau
Publisher:
Cengage Learning
MATLAB: An Introduction with Applications
Statistics
ISBN:
9781119256830
Author:
Amos Gilat
Publisher:
John Wiley & Sons Inc
Probability and Statistics for Engineering and th…
Statistics
ISBN:
9781305251809
Author:
Jay L. Devore
Publisher:
Cengage Learning
Statistics for The Behavioral Sciences (MindTap C…
Statistics
ISBN:
9781305504912
Author:
Frederick J Gravetter, Larry B. Wallnau
Publisher:
Cengage Learning

Elementary Statistics: Picturing the World (7th E…
Statistics
ISBN:
9780134683416
Author:
Ron Larson, Betsy Farber
Publisher:
PEARSON

The Basic Practice of Statistics
Statistics
ISBN:
9781319042578
Author:
David S. Moore, William I. Notz, Michael A. Fligner
Publisher:
W. H. Freeman

Introduction to the Practice of Statistics
Statistics
ISBN:
9781319013387
Author:
David S. Moore, George P. McCabe, Bruce A. Craig
Publisher:
W. H. Freeman