When the admission price for a baseball game was $4 per ticket, 70,000 tickets were sold. When the price was raised to $5, only 63,000 tickets were sold. Assume that the demand function is linear and that the variable and fixed costs for the ball park owners are so.10 and $85,000 respectively. (a) Find the profit Pas a function of x, the number of tickets sold. P(x) = (b) Select the graph of P. 200 000 200000 200000 200 000 100 000 100 000 100 000 100000 20000 40 000 60 000 80000/ 20 000 40 000 60 000 80000 20000 40 000 60 000 80 000 20000 40 000 60 000 80000 -100 000 - 100 000 -100 000 -100000 -200 000 -200 000 - 200000 -200 000 (c) Find the marginal profits when 35,000 tickets were sold and when 70,000 tickets were sold. P(35,000) = per ticket per ticket P(70,000) -
When the admission price for a baseball game was $4 per ticket, 70,000 tickets were sold. When the price was raised to $5, only 63,000 tickets were sold. Assume that the demand function is linear and that the variable and fixed costs for the ball park owners are so.10 and $85,000 respectively. (a) Find the profit Pas a function of x, the number of tickets sold. P(x) = (b) Select the graph of P. 200 000 200000 200000 200 000 100 000 100 000 100 000 100000 20000 40 000 60 000 80000/ 20 000 40 000 60 000 80000 20000 40 000 60 000 80 000 20000 40 000 60 000 80000 -100 000 - 100 000 -100 000 -100000 -200 000 -200 000 - 200000 -200 000 (c) Find the marginal profits when 35,000 tickets were sold and when 70,000 tickets were sold. P(35,000) = per ticket per ticket P(70,000) -

Algebra for College Students
10th Edition
ISBN:9781285195780
Author:Jerome E. Kaufmann, Karen L. Schwitters
Publisher:Jerome E. Kaufmann, Karen L. Schwitters
Chapter8: Functions
Section8.CT: Test
Problem 19CT

Related questions

Concept explainers
Contingency Table
A contingency table can be defined as the visual representation of the relationship between two or more categorical variables that can be evaluated and registered. It is a categorical version of the scatterplot, which is used to investigate the linear relationship between two variables. A contingency table is indeed a type of frequency distribution table that displays two variables at the same time.
Binomial Distribution
Binomial is an algebraic expression of the sum or the difference of two terms. Before knowing about binomial distribution, we must know about the binomial theorem.
Topic Video
Question
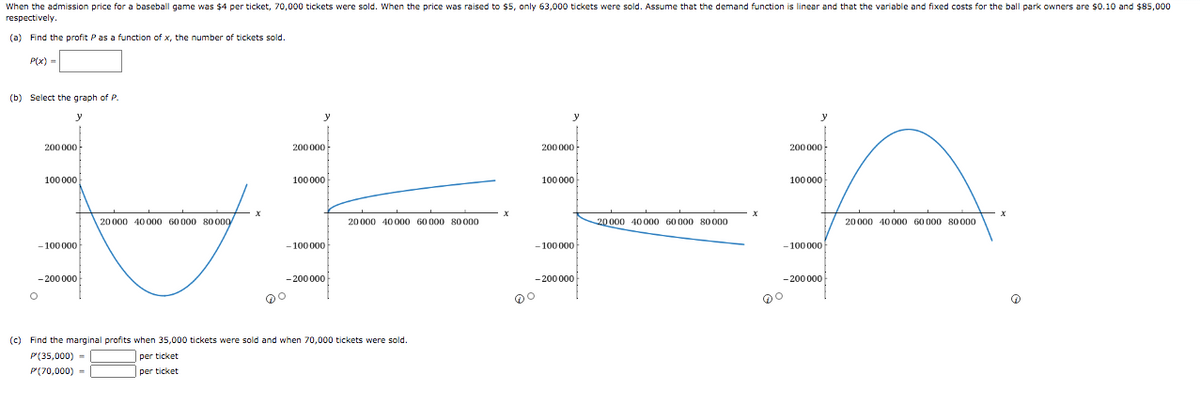
Transcribed Image Text:When the admission price for a baseball game was $4 per ticket, 70,000 tickets were sold. when the price was raised to $5, only 63,000 tickets were sold. Assume that the demand function is linear and that the variable and fixed costs for the ball park owners are $0.10 and $85,000
respectively.
(a) Find the profit P as a function of x, the number of tickets sold.
P(x) =
(b) Select the graph of P.
y
y
200 000-
200 000
200 000
200 000-
100000
100000
100000
100 000
20000 40 000 60 000 8000
20 000 40 000 60 000 80000
20000 40 000o 60 000 80 000
20000 40 000 60 000 80 000
-100 000
-100 000
- 100 000
100 000
-200 000
-200000
- 200 000
-200 000-
(c) Find the marginal profits when 35,000 tickets were sold and when 70,000 tickets were sold.
P(35,000) -
P(70,000) =
per ticket
per ticket
Expert Solution
This question has been solved!
Explore an expertly crafted, step-by-step solution for a thorough understanding of key concepts.

This is a popular solution!

Trending now
This is a popular solution!

Step by step
Solved in 5 steps

Knowledge Booster


Learn more about
Need a deep-dive on the concept behind this application? Look no further. Learn more about this topic, calculus and related others by exploring similar questions and additional content below.Recommended textbooks for you
Algebra for College Students
Algebra
ISBN:
9781285195780
Author:
Jerome E. Kaufmann, Karen L. Schwitters
Publisher:
Cengage Learning

Glencoe Algebra 1, Student Edition, 9780079039897…
Algebra
ISBN:
9780079039897
Author:
Carter
Publisher:
McGraw Hill

Algebra and Trigonometry (MindTap Course List)
Algebra
ISBN:
9781305071742
Author:
James Stewart, Lothar Redlin, Saleem Watson
Publisher:
Cengage Learning
Algebra for College Students
Algebra
ISBN:
9781285195780
Author:
Jerome E. Kaufmann, Karen L. Schwitters
Publisher:
Cengage Learning
Glencoe Algebra 1, Student Edition, 9780079039897…
Algebra
ISBN:
9780079039897
Author:
Carter
Publisher:
McGraw Hill
Algebra and Trigonometry (MindTap Course List)
Algebra
ISBN:
9781305071742
Author:
James Stewart, Lothar Redlin, Saleem Watson
Publisher:
Cengage Learning

Holt Mcdougal Larson Pre-algebra: Student Edition…
Algebra
ISBN:
9780547587776
Author:
HOLT MCDOUGAL
Publisher:
HOLT MCDOUGAL