where not met in 200 iterations Show Intro/Instructions You wish to determine if there is a linear correlation between the age of a driver and the number of driver deaths. The following table represents the age of a driver and the number of driver deaths per 100,000. Use a significance level of 0.01 and round all values to 4 decimal places. Driver Age Number of Driver Deaths per 100,000 43 34 57 23 32 36 43 26 30 30 19 36 35 32 60 20 53 28 Ho: p = 0 Ha: p 0 Find the Linear Correlation Coefficient Find the p-value p-value = The p-value is O Greater than a O Less than (or equal to) a The p-value leads to a decision to ODo Not Reject Ho O Accept Ho OReject Ho The conclusion is O There is a significant negative linear correlation between driver age and number of driver deaths. O There is insufficient evidence to make a conclusion about the linear correlation between driver age and number of driver deaths. O There is a significant positive linear correlation between driver age and number of driver deaths. OThere is a significant linear correlation between driver age and number of driver deaths.
where not met in 200 iterations Show Intro/Instructions You wish to determine if there is a linear correlation between the age of a driver and the number of driver deaths. The following table represents the age of a driver and the number of driver deaths per 100,000. Use a significance level of 0.01 and round all values to 4 decimal places. Driver Age Number of Driver Deaths per 100,000 43 34 57 23 32 36 43 26 30 30 19 36 35 32 60 20 53 28 Ho: p = 0 Ha: p 0 Find the Linear Correlation Coefficient Find the p-value p-value = The p-value is O Greater than a O Less than (or equal to) a The p-value leads to a decision to ODo Not Reject Ho O Accept Ho OReject Ho The conclusion is O There is a significant negative linear correlation between driver age and number of driver deaths. O There is insufficient evidence to make a conclusion about the linear correlation between driver age and number of driver deaths. O There is a significant positive linear correlation between driver age and number of driver deaths. OThere is a significant linear correlation between driver age and number of driver deaths.

Glencoe Algebra 1, Student Edition, 9780079039897, 0079039898, 2018
18th Edition
ISBN:9780079039897
Author:Carter
Publisher:Carter
Chapter10: Statistics
Section: Chapter Questions
Problem 25SGR

Related questions
Question
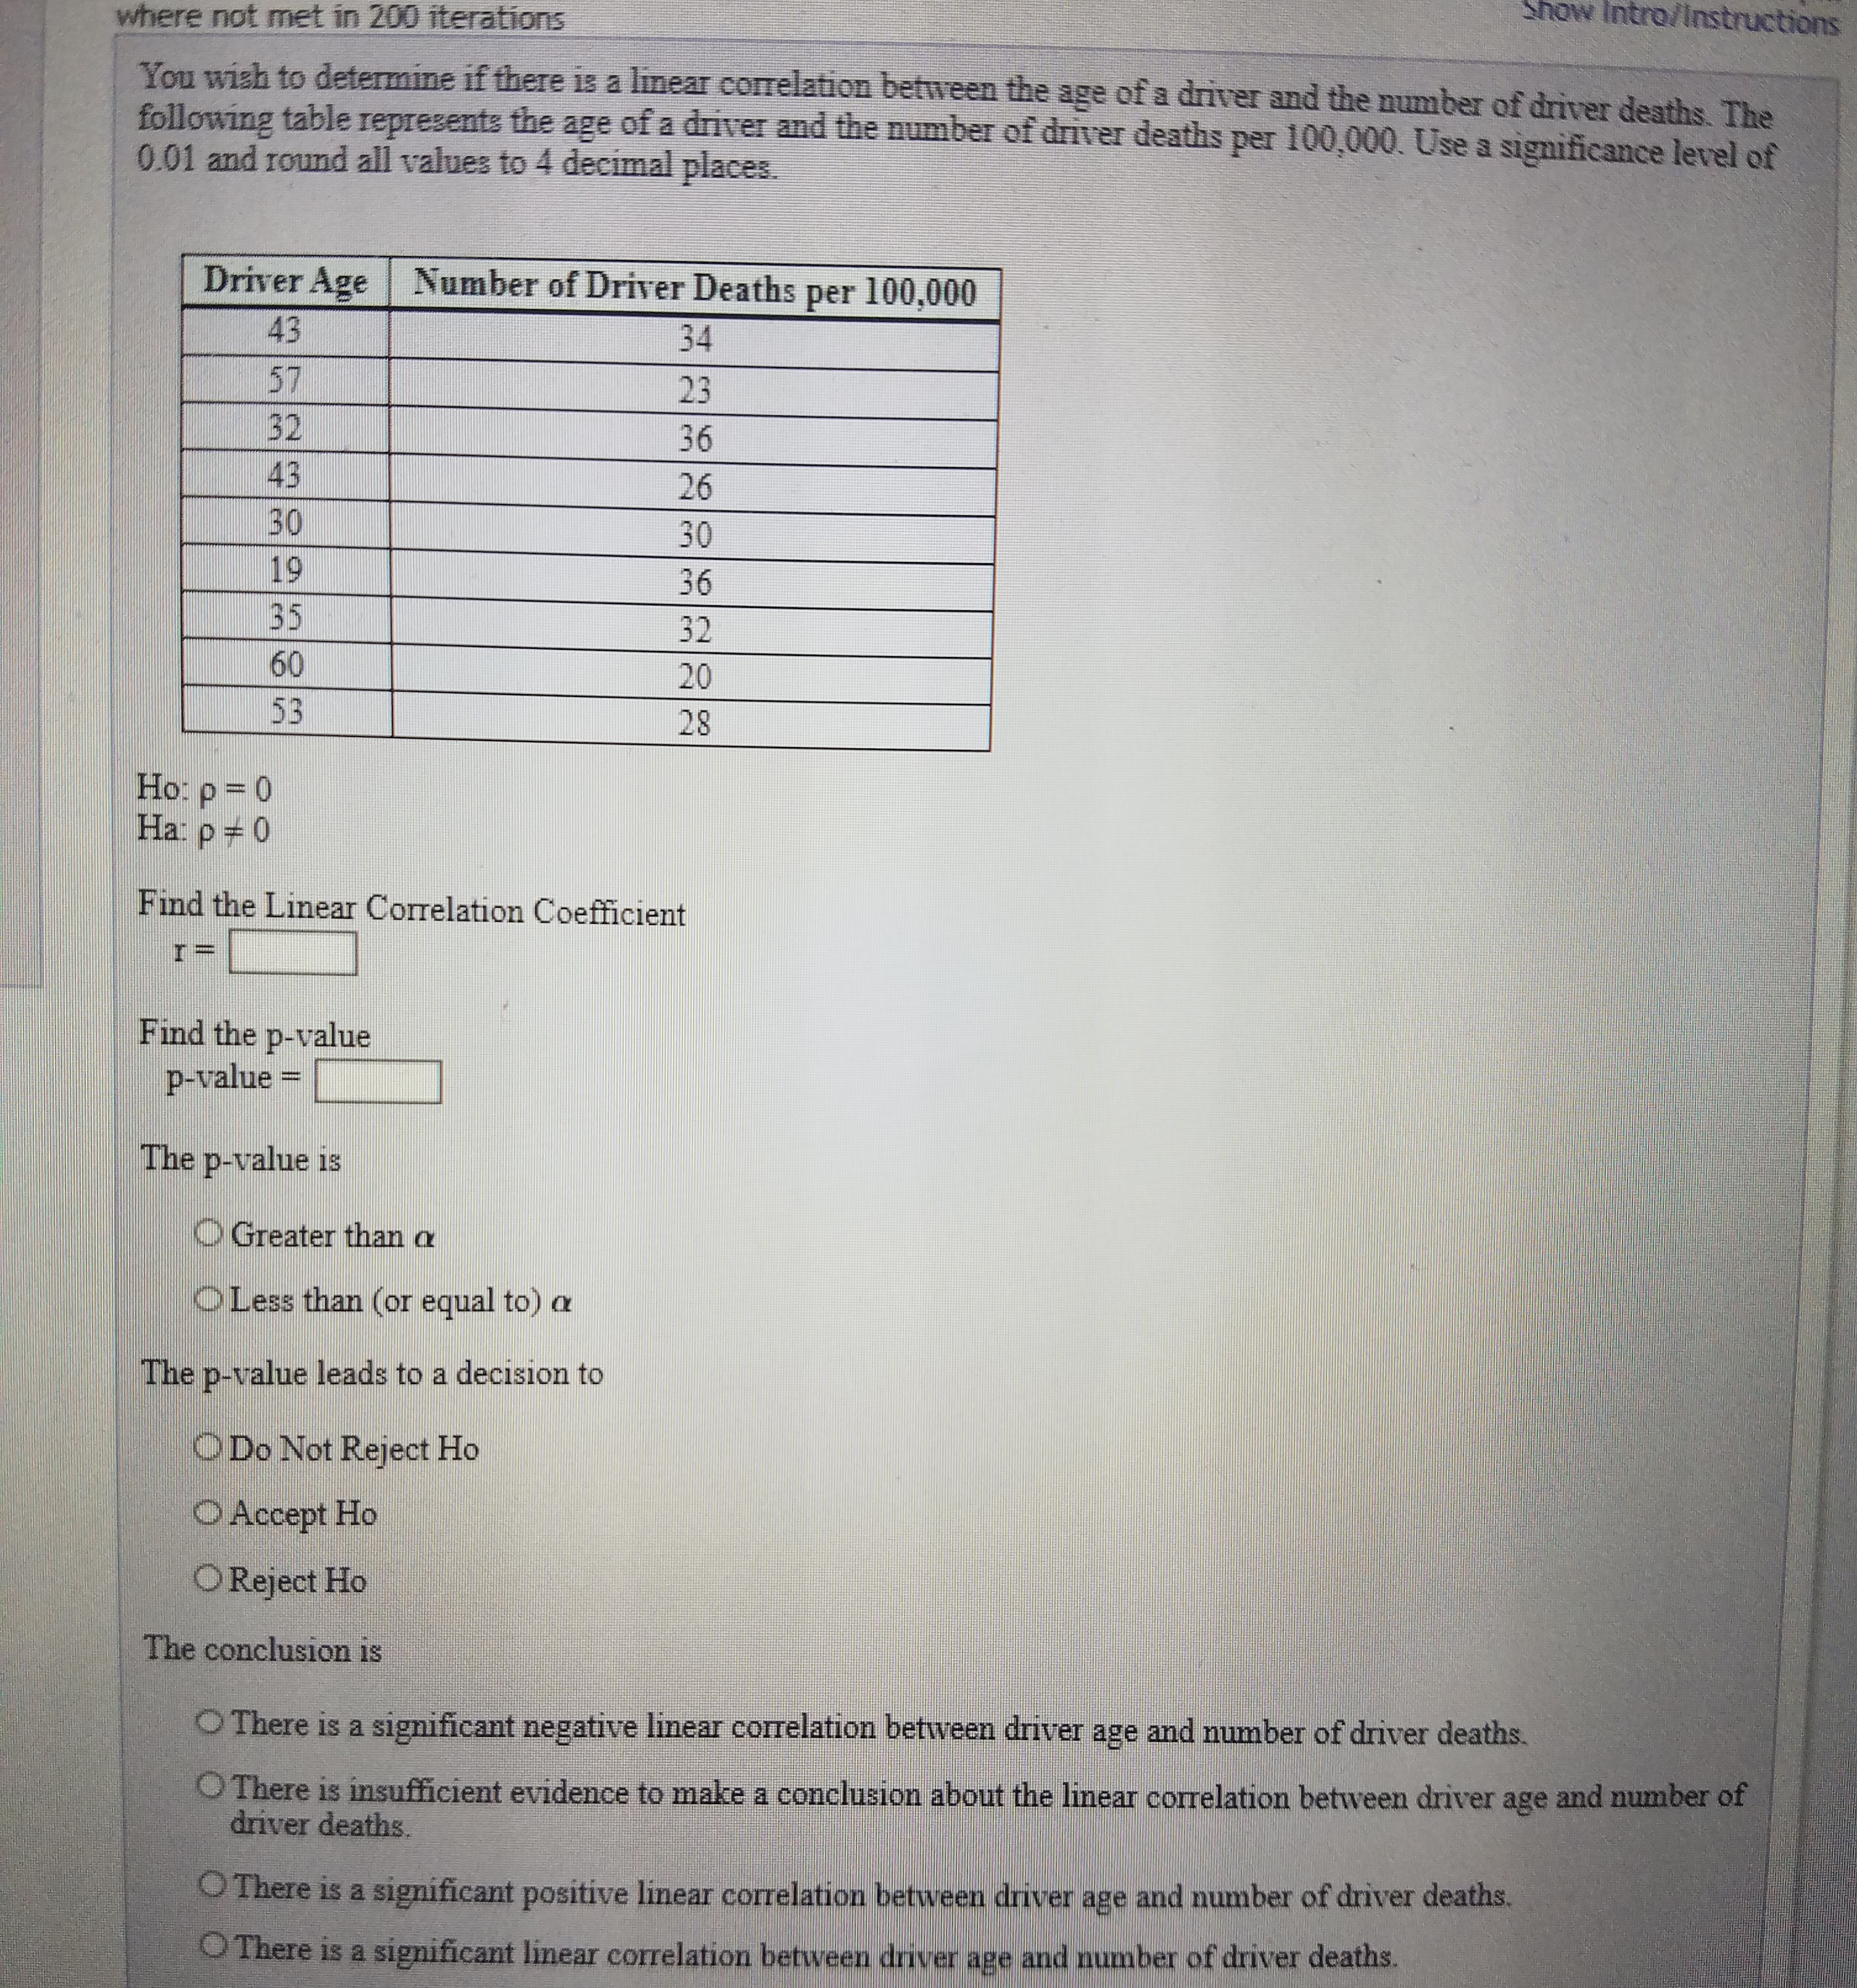
Transcribed Image Text:where not met in 200 iterations
Show Intro/Instructions
You wish to determine if there is a linear correlation between the age of a driver and the number of driver deaths. The
following table represents the age of a driver and the number of driver deaths per 100,000. Use a significance level of
0.01 and round all values to 4 decimal places.
Driver Age Number of Driver Deaths per 100,000
43
34
57
23
32
36
43
26
30
30
19
36
35
32
60
20
53
28
Ho: p = 0
Ha: p 0
Find the Linear Correlation Coefficient
Find the p-value
p-value =
The p-value is
O Greater than a
O Less than (or equal to) a
The p-value leads to a decision to
ODo Not Reject Ho
O Accept Ho
OReject Ho
The conclusion is
O There is a significant negative linear correlation between driver age and number of driver deaths.
O There is insufficient evidence to make a conclusion about the linear correlation between driver age and number of
driver deaths.
O There is a significant positive linear correlation between driver age and number of driver deaths.
OThere is a significant linear correlation between driver age and number of driver deaths.
Expert Solution
This question has been solved!
Explore an expertly crafted, step-by-step solution for a thorough understanding of key concepts.

This is a popular solution!

Trending now
This is a popular solution!

Step by step
Solved in 3 steps with 5 images

Recommended textbooks for you
Glencoe Algebra 1, Student Edition, 9780079039897…
Algebra
ISBN:
9780079039897
Author:
Carter
Publisher:
McGraw Hill
Glencoe Algebra 1, Student Edition, 9780079039897…
Algebra
ISBN:
9780079039897
Author:
Carter
Publisher:
McGraw Hill