Which of the following best describes the shape of the lead level distributions in both sex groups? left (negatively) skewed O right (positively skewed) Approximately normal uniform
Which of the following best describes the shape of the lead level distributions in both sex groups? left (negatively) skewed O right (positively skewed) Approximately normal uniform

Glencoe Algebra 1, Student Edition, 9780079039897, 0079039898, 2018
18th Edition
ISBN:9780079039897
Author:Carter
Publisher:Carter
Chapter4: Equations Of Linear Functions
Section: Chapter Questions
Problem 8SGR

Related questions

Concept explainers
Contingency Table
A contingency table can be defined as the visual representation of the relationship between two or more categorical variables that can be evaluated and registered. It is a categorical version of the scatterplot, which is used to investigate the linear relationship between two variables. A contingency table is indeed a type of frequency distribution table that displays two variables at the same time.
Binomial Distribution
Binomial is an algebraic expression of the sum or the difference of two terms. Before knowing about binomial distribution, we must know about the binomial theorem.
Topic Video
Question
only answer needed
Transcribed Image Text:2.
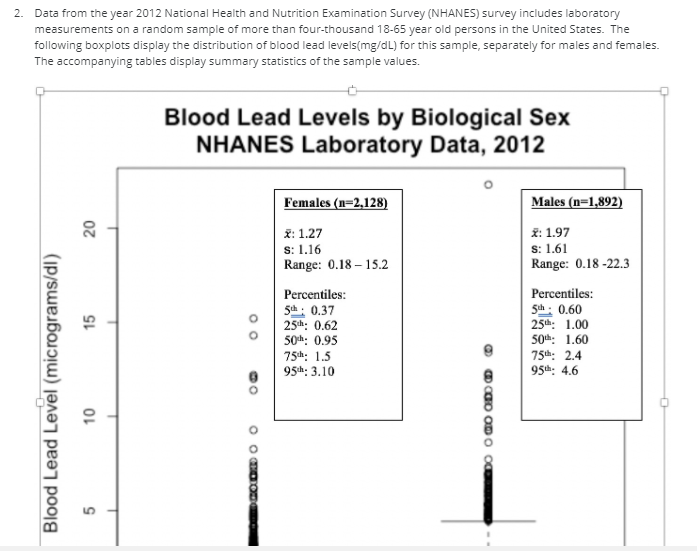
Data from the year 2012 National Health and Nutrition Examination Survey (NHANES) survey includes laboratory
measurements on a random sample of more than four-thousand 18-65 year old persons in the United States. The
following boxplots display the distribution of blood lead levels(mg/dL) for this sample, separately for males and females.
The accompanying tables display summary statistics of the sample values.
Blood Lead Levels by Biological Sex
NHANES Laboratory Data, 2012
Females (n=2,128)
Males (n=1,892)
20
*: 1.27
s: 1.16
Range: 0.18 – 15.2
ž: 1.97
s: 1.61
Range: 0.18 -22.3
Percentiles:
Percentiles:
5h : 0.37
25th: 0.62
Sth: 0.60
25th: 1.00
50h: 0.95
50h: 1.60
75th: 2.4
95th: 4.6
75th: 1.5
95th: 3.10
O O OO D
SL
OL
Blood Lead Level (micrograms/dl)
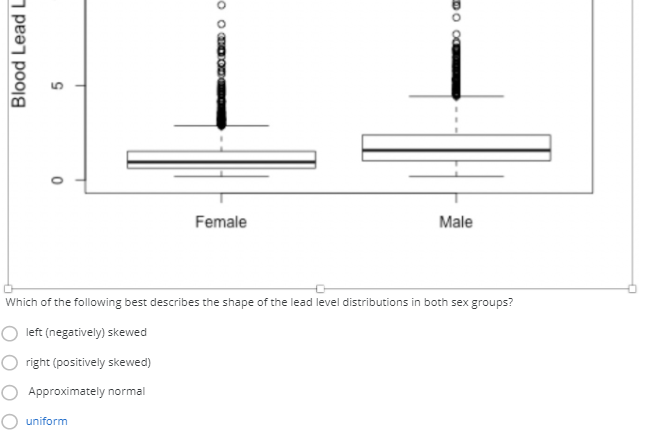
Transcribed Image Text:Female
Male
Which of the following best describes the shape of the lead level distributions in both sex groups?
left (negatively) skewed
O right (positively skewed)
O Approximately normal
uniform
Blood Lead L
DO oa
Expert Solution
This question has been solved!
Explore an expertly crafted, step-by-step solution for a thorough understanding of key concepts.

This is a popular solution!

Trending now
This is a popular solution!

Step by step
Solved in 2 steps

Knowledge Booster


Learn more about
Need a deep-dive on the concept behind this application? Look no further. Learn more about this topic, statistics and related others by exploring similar questions and additional content below.Recommended textbooks for you
Glencoe Algebra 1, Student Edition, 9780079039897…
Algebra
ISBN:
9780079039897
Author:
Carter
Publisher:
McGraw Hill
Glencoe Algebra 1, Student Edition, 9780079039897…
Algebra
ISBN:
9780079039897
Author:
Carter
Publisher:
McGraw Hill