Which of the following p-values indicates the weakest sample evidence against the null hypothesis? O 0.20 O 0.05 O 0.10 O 0.01 O 0.005
Which of the following p-values indicates the weakest sample evidence against the null hypothesis? O 0.20 O 0.05 O 0.10 O 0.01 O 0.005

College Algebra (MindTap Course List)
12th Edition
ISBN:9781305652231
Author:R. David Gustafson, Jeff Hughes
Publisher:R. David Gustafson, Jeff Hughes
Chapter8: Sequences, Series, And Probability
Section8.CT: Chapter Test
Problem 24CT: Show the sample space of the experiment: toss a fair coin three times.

Related questions
Question
30)
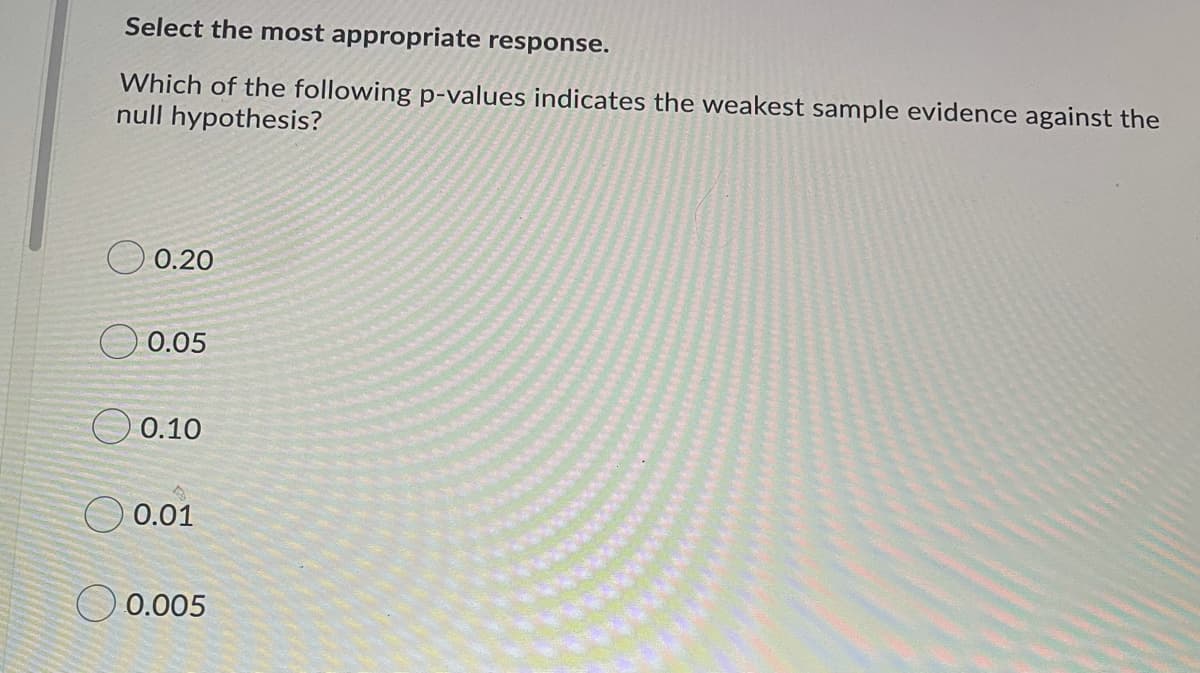
Transcribed Image Text:Select the most appropriate response.
Which of the following p-values indicates the weakest sample evidence against the
null hypothesis?
O 0.20
O 0.05
O 0.10
O 0.01
O 0.005
Expert Solution
This question has been solved!
Explore an expertly crafted, step-by-step solution for a thorough understanding of key concepts.

This is a popular solution!

Trending now
This is a popular solution!

Step by step
Solved in 2 steps

Recommended textbooks for you
College Algebra (MindTap Course List)
Algebra
ISBN:
9781305652231
Author:
R. David Gustafson, Jeff Hughes
Publisher:
Cengage Learning
College Algebra (MindTap Course List)
Algebra
ISBN:
9781305652231
Author:
R. David Gustafson, Jeff Hughes
Publisher:
Cengage Learning