

Q: 8. For what values of k will the set {(4,2), (5,10), (k – 1,7), (6,12)} represent a function?
A:
Q: Evaluate using the graph of f(r) and g(r) : ( +g)(4) 4. 1 2 3 4 5 6.
A:
Q: If f(x) = 5 – x and g (x) = vx + 3, the range of the graph of is O a) {y]y > –11, y E R} O b) {y]y >…
A:
Q: Which of the following relations is not a function? a.{(3,3), (2,3),(0,4),(1,4)} b. {(3,3), (2,3),…
A:
Q: e) What are the domain and the range for this situation?
A: Topic:- calculus
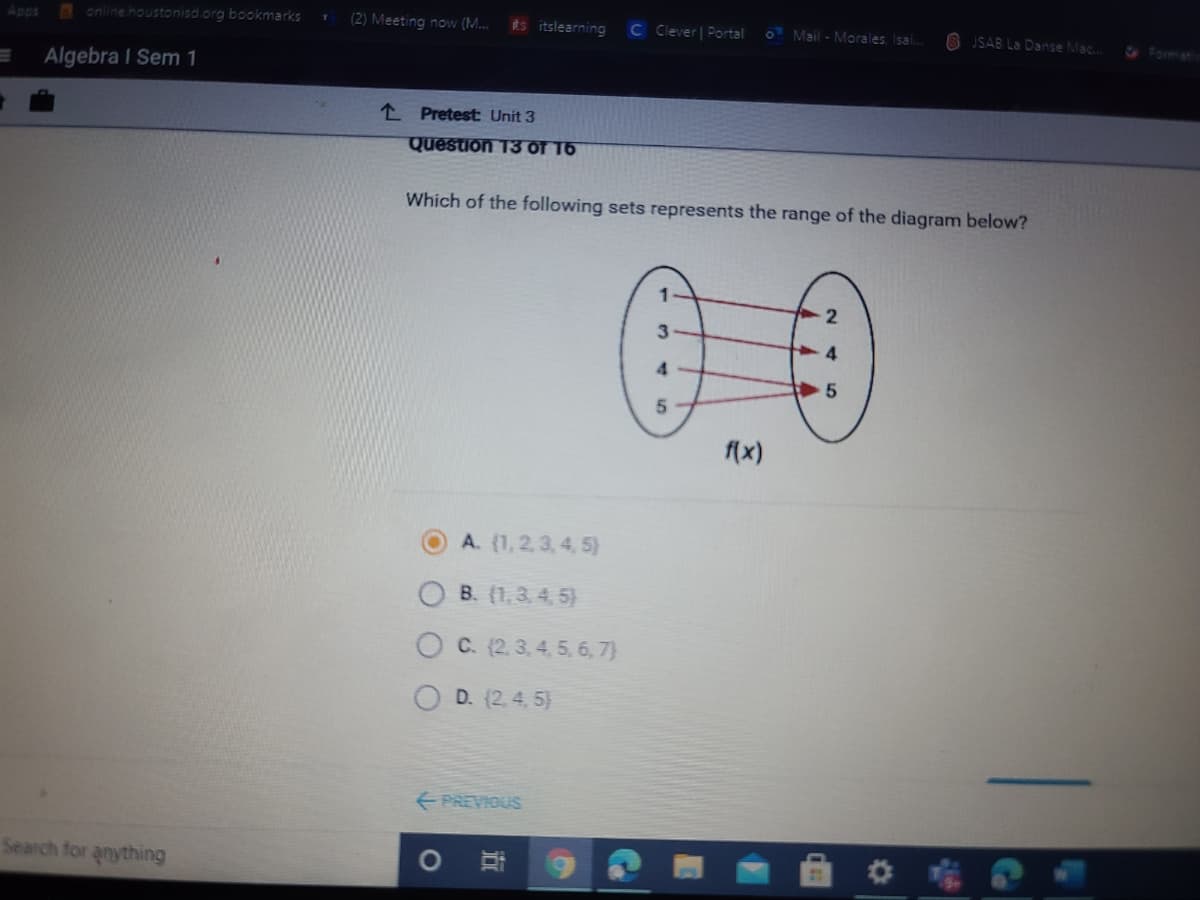
Q: Given the following graph of f(x), state a) the domain b) the range 3t -6 -5 -4 -3 -2 -1 4
A:
Q: 1. State whether or not the following relations are functions. а. {(2,2), (4,4), (6,6)} b. {(5,3),…
A:
Q: Which of the following sets is a function? * {(a, a)b,b)\a,c)} {(a,b){b,cXc,a} Option 2 О Оption 4…
A: We have to identify which of the following set is a function.
Q: For the function below ... the * ?range is (x + 2)³ y = (x² – 4) R/{0,16} O R/{-1,4} O R/{3,-4} O…
A:
Q: 22. The following ordered pairs represent a function. (-2, 2), (-1, 1), (0, 0), (1, 1). (2, 2) Which…
A:
Q: 13. Which of the following sets is a function? А. ((3, 1), (3, 2), (3,5)} B. {(-1,–1), (–2, 7),…
A:
Q: In which set of ordered pairs is y a function of x? О А. {(3, 1), (4, 5), (3, 2), (4, 8)} о в. {(2,…
A:
Q: Identify the functions on the following set of ordered pairs. A = {(1, 2), (2, 3), (3, 4), (4, 5)) B…
A:
Q: Use the graph of f(x) shown below to answer each question. -2
A: Increasing function: A function is increasing over an interval if the value of the function…
Q: Given S={(2,3), (2,5), (4,1}, (6,1)} on A={2,4,6} and B={1,3,5}. Is the relation S a function from A…
A: Given A={2,4,6} and B={1,3,5}, And relation, S={(2,3), (2,5), (4,1}, (6,1)}
Q: Which of the following relations does not represen a function? A. (4, 4), (5, 4), (6, 4)} B. (4, 4),…
A: We will use definition of function to solve this
Q: If f(x, y) = 25 - 5x2 - y? , find f(9, 4) and f,(9, 4) and interpret these numbers as slopes. f(9,…
A: The given problem is to find the values of fx(9,4) and fy(9,4). Given function f(x,y) = 25-5x2-y2.
Q: What is the range of the given relation? {(,2), (3, 4). (0,0), (1,)} Edit View Insert Format Tools…
A: if (x,y) belong to relation the y belong to range
Q: Use the graphs of f and g to evaluate g(f(2)) y (2,4) (4,3) (-2,1) f (2,-2)
A:
Q: For a functionf (x, y), we are givenf (100, 20) = 2250, and f. (100, 20) = 8, andf, (100, 20) = 7.…
A: The detailed solution is as follows below:
Q: Which of the following sets represents one to one function? Select one: O a.{(1,-5), (-1, 6), (2,…
A:
Q: . Which of the following sets of points does NOT represent a function? D {(-2,0), (-1, 1), (0, 4),…
A: NOTE: Refresh your page if you can't see any equations. . check the first option as we can see,…
Q: Which of the following sets of ordered pairs below represent a function? O {(0,0),(10,-1),(4,…
A: Function :- A relation from a set of inputs to a set of possible outputs where each input is related…
Q: = { }, ,, 9 7> 49 343 2401 ' • • 81 Find a general term (as a function of the variable n) for the…
A:
Q: Produce a table for t = 0, 1 ,2 ,3, 4, and 5 and graph the function N, = 3'. 3 4 2.
A: Since there are two questions posted, we will answer the first question posted. If you want the…
Q: 1 6. Find the range of the function y =x +3 when the domain is {-2, 0, 2, 4}? 2
A:
Q: Determine the domain and range of the function using the graph below: 15+ 14 13 12 10 9- 용 7- 4 4…
A:
Q: Which of the following sets is a function" ((7, 3), (8, 1), (7, 6)} B. ((1, 3), (4, 5), (4, 8)} C.…
A: A function is relation between the elements one set (domain) to another set (co-domain) such that…
Q: Use this table to find the foloowing x 0,1,2,3,4,5,6,7,8,9, f 7,6,5,8,4,0,2,1,9,3 g…
A:
Q: Evaluate the function at the specified points in the figure below
A: A function is a relation which maps each value in its domain to exactly one value in its range. The…
Q: Given that the domain of the function f is [-4,4] and the range of ff is [-2,5]. A graph of the…
A: According to our guidelines we are supposed to do only one question. Kindly repost the other…
Q: If a function is defined by the formula y =x+3 and its domain is given by the set {-4, 0, 8}, then…
A: The given function is y=12x+3 and the domain is -4,0,8.
Q: What is the range of the relation below? O-2sy54 O -4Sy54 O -3<ys-2 O-3<y54 O 14.-3,-2,-1,0,1,2,3,4)
A:
Q: Graph the functions f(x) = xn for n = 1, 3, and 5 in a [-2, 2, 1] by [-2, 2, 1] viewing rectangle.
A: Given The function f(x) = xn for n = 1, 3, and 5 .
Q: Ms. Yardley wrote four sets of ordered pairs on the whiteboard for her math students. For which set…
A:
Q: If (-1,8) is a point on the graph of y = f(x), which of the following must be on the graph of y…
A: We have to find the point which must be on the graph of y= f(-x).
Q: Given the graph of fx), determine the range of f(x) • 8 -10-9-8-7-6-5 OR O(-1) (1.) O(-2) u (2) O(1)…
A: Range of an inverse function is the domain of the orginal function.
Q: A1. Which of the following relations is a function? А. ((9,4), (-7, -4), (3,—5), (—3,5)} {(2, 1),…
A:
Q: Which of the following relation represents a function? Select all that apply. a. {(2, 10), (8, 8),…
A: Given:- a. {(2, 10), (8, 8), (−4, 7), (3, 10)} b. {(8, 6), (−2,−1), (−4,−2), (−2, 8)} c. {(−3, 4),…
Q: Which of the following diagrams represent a function? Let X = {1,2,3,4} and Y = {a,b,c,d}. f:X-Y 2 3…
A: A function f: X→Y is a mapping that associates each element of X to a unique element of Y f:X→Y…
Q: Given a function described as the table below, what is y when x is 4? 10 9. 7 3 2 4 6. X-axis +++++…
A: Given, The graph is shown below: To find: The value of y when x is 4.
Q: Given the following graph of f(x), state --6-5-4-3-2-1 3- 2+ 3 4 a) the domain b) the range
A:
Q: Use the graphs of f and g to evaluate g(f(2)) y (2,4) (4,3) (-2,1) If (2,-2) 04 O 2 O-2
A: Please refer the attached image for complete solution.
Q: Which of the following ordered pairs represent the ordered pairs for a function Select one: a.…
A:
Q: What is the range of the following relation? (9, -2) (4, 3) (8, 10) ( -4, 8)
A: Given: R=9,-2, 4,3, 8,10, -4,8
Q: Which of the following diagrams represents a function? And give the reasons why it is a function or…
A:
Q: For the set of ordered pairs f= {(-1, 4), (0, 3), (1, 4), (2,-2). Give the domain and range:…
A: Given f = {(-1,4) , (0,3) ,(1,4) ,(2,-2)}
Q: Which of the following sets of ordered pairs below represent a function? O…
A: Using definition of function.
Q: 1. Which of the following relations is a function? a) {(1,9), (2, 4), (2, 3), (4, 15)} b) {(2,7),…
A:
Q: Q3: Define which of the following set of data represent a function or relation. 2 -4 8 9 y -5 11 3…
A: Given query is to find the which represents function and relation.


Trending now
This is a popular solution!

Step by step
Solved in 2 steps


- The following data set shows the number of children in each household in Anmol's neighborhood. 0, 0, 2, 1, 2, 8, 3, 0, 0 What is the range of children in these households? childrenWhich of the following statements is incorrect?(A) Both dotplots and stemplots can show symmetry, gaps, clusters, and outliers.(B) Sets with different distribution shapes can have identical boxplots.(C) Boxplots, dotplots, stemplots, and histograms can all show skewness.(D) In histograms, relative areas correspond to relative frequencies.(E) In histograms, frequencies can be determines from relative heights.Some users of statistics prefer pie charts to bar charts because people are accustomed to having the horizontal axis of a graph show order. For example, someone might infer from Fig. on page 46 that “Republican” is less than “Other” because “Republican” is shown to the left of “Other” on the horizontal axis. Pie charts do not lead to such inferences. Give other advantages and disadvantages of each method. FIGURE Bar chart of the political party affiliation data in Table
- A pediatrician wants to determine the relation that may exist between a child's height and head circumference. She randomly selects 8 children from her practice, measures their height and head circumference and obtains the data shown below. Height Head Circumference 27 17.5 25 17 26.5 17.2 25.5 17 27.75 17.4 26.25 17.4 26 17.1 27.25 17.4 data table 3 0.997 4 0.950 5 0.878 6 0.811 7 0.754 8 0.707 9 0.666 10 0.632 11 0.602 12 0.576 13 0.553 14 0.532 15 0.514 16 0.497 17 0.482 18 0.468 19 0.456 20 0.444 21 0.433 22 0.423 23 0.413 24 0.404 25 0.396 26 0.388 27 0.381 28 0.374…A pediatrician wants to determine the relation that may exist between a child's height and head circumference. She randomly selects 8 children from her practice, measures their height and head circumference and obtains the data shown below. Height Head Circumference 27 17.5 25 17 26.5 17.2 25.5 17 27.75 17.4 26.25 17.4 26 17.1 27.25 17.4 data table n 3 0.997 4 0.950 5 0.878 6 0.811 7 0.754 8 0.707 9 0.666 10 0.632 11 0.602 12 0.576 13 0.553 14 0.532 15 0.514 16 0.497 17 0.482 18 0.468 19 0.456 20 0.444 21 0.433 22 0.423 23 0.413 24 0.404 25 0.396 26 0.388 27 0.381 28 0.374 29 0.367 30 0.361 compute the linear correlation coefficient between the height and head circumference of a child. r = ____ (round to three decimal places as…Milly’s 20 quizzes scores 5.5 9 6 8 5 5.5 9.5 6 9 6 1 6 10 8.5 8 4 10 8 9 6 Billy’s 19 quizzes scores 6 7 5 7 8 6 8 6 8 9 6 6.5 7 7 8 6 8.5 7.5 6.5 a) find out what the Five numbers are for Milly and Billy respectively. b) find out the values of range, IQR, and outliers, for Milly and Billy respectively. c) construct boxplots so as to compare the performance of the two students.
- A pediatrician wants to determine the relation that may exist between a child's height and head circumference. She randomly selects 8 children from her practice, measures their height and head circumference and obtains the data shown below. Height Head Circumference 27 17.5 25 17 26.5 17.2 25.5 17 27.75 17.4 26 17.1 27.25 17.4 n 3 0.997 4 0.950 5 0.878 6 0.811 7 0.754 8 0.707 9 0.666 10 0.632 11 0.602 12 0.576 13 0.553 14 0.532 15 0.514 16 0.497 17 0.482 18 0.468 19 0.456 20 0.444 21 0.433 22 0.423 23 0.413 24 0.404 25 0.396 26 0.388 27 0.381 28 0.374 29 0.367 30 0.361 e) Convert the data to centimeters (1 inch = 2.54 cm) and recompute the linear correlation coefficient. What i effect did the…A pediatrician wants to determine the relation that may exist between a child's height and head circumference. She randomly selects 8 children from her practice, measures their height and head circumference and obtains the data shown below. Height Head Circumference 27 17.5 25 17 26.5 17.2 25.5 17 27.75 17.4 26 17.1 27.25 17.4 n 3 0.997 4 0.950 5 0.878 6 0.811 7 0.754 8 0.707 9 0.666 10 0.632 11 0.602 12 0.576 13 0.553 14 0.532 15 0.514 16 0.497 17 0.482 18 0.468 19 0.456 20 0.444 21 0.433 22 0.423 23 0.413 24 0.404 25 0.396 26 0.388 27 0.381 28 0.374 29 0.367 30 0.361 Convert the data to centimeters (1 inch to 2.54 cm), and recompute the linear correlation coefficient. What effect did the…Here is a data set: 369 386 363 354 312 352 251 417 330 358 435 338 341 407 311 283 335 335 346 355 288 336 344 417 356 279 280 396 Construct a grouped frequency distribution table (GFDT) for this data set. You want 10 classes with a "nice" class width. Your classes should be labeled using interval notation. Each class contains its lower class limit, and the lower class limits should all be multiples of the class width. In that the data appears to be discrete, use a closed-interval to label each class. Hint: The first class is [240,259]. This is the format all classes should be entered. Data range Frequency
- A pediatrician wants to determine the relation that exists between a child's height, x, and head circumference, y. She randomly selects 11 children from her practice, measures their heights and head circumferences, and obtains the accompanying data. Height (inches), x Head Circumference (inches), y28 17.624.75 17.225.75 17.226 17.625 17.127.75 17.726.75 17.427 17.626.75 17.426.75 17.627.5 17.6 1. ŷ= ___x+ _____ 2. Compute the linear correlation coefficient between the height and head circumference of a child.…The following are distances (in miles) traveled to the workplace by 22 employees of a certain computer company. 7 , 2 , 37 , 32 , 27 , 22 , 16 , 11 , 6 , 1 , 36 , 31 , 25 , 20 , 15 , 10 , 29 , 29 , 24 , 24 , 24 , 9 Send data to calculator Draw the histogram for these data using an initial class boundary of 0.5 , an ending class boundary of 45.5 , and 5 classes of equal width. Note that you can add or remove classes from the figure. Label each class with its endpoints.An instructor wants to compare the performance on a test between her 1st period students and her 2nd period students. Below is the box plots for each period. Which of the following statements below is correct?


