Which of the following statements about correlation r = 0.923 is TRUE? Circle ONE answer. No explanation is required. (i) The sample SD of the predicted values of the swimming speed is r2 = (0.9234)2 0.85 = sample SD of the response (swimming speed). 85% of the (ii) The sample variance of the predicted values of the swimming speed is r2 = (0.923)2 0.85 = of the sample variance of the response (swimming speed). 85% (iii) The sample SD of the residuals is 1-r = 1 - 0.9234 7.7% of the sample SD of the response (swimming speed). (iv) The sample variance of the residuals is 1 - r = 1 - 0.9234 7.7% of the sample variance of the response (swimming speed).


Correlation
Correlation defines a relationship between two independent variables. It tells the degree to which variables move in relation to each other. When two sets of data are related to each other, there is a correlation between them.
Linear Correlation
A correlation is used to determine the relationships between numerical and categorical variables. In other words, it is an indicator of how things are connected to one another. The correlation analysis is the study of how variables are related.
Regression Analysis
Regression analysis is a statistical method in which it estimates the relationship between a dependent variable and one or more independent variable. In simple terms dependent variable is called as outcome variable and independent variable is called as predictors. Regression analysis is one of the methods to find the trends in data. The independent variable used in Regression analysis is named Predictor variable. It offers data of an associated dependent variable regarding a particular outcome.
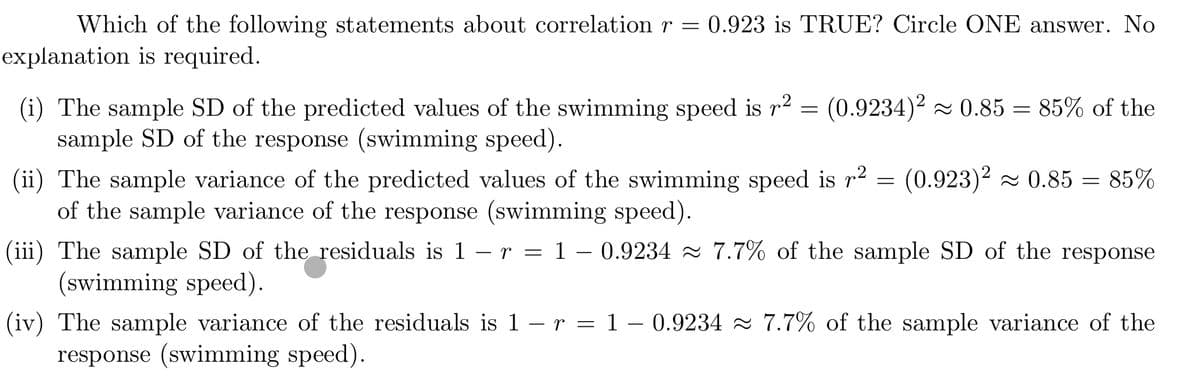
![A biologist was interested in the relationship between the ve-
locity at which a beluga whale swims and the tail-beat fre-
quency of the whale. A sample of 19 whales was studied and
measurements were made on swimming velocity, measured in
units of body lengths of the whale per second and tail-beat
frequency, measured in units of hertz (number of tail beat per
second) The following regression output is for predicting the
swimming speed of a beluga whale from it's tail-beat frequency.
Part of the output is blurred.
Coefficients:
Estimate Std. Error t value Pr(>|t])
0.6
0.8
1.0
1.2
1.4
1.6
(Intercept)
0.07075
0.828
Tail Beat Frequency (Hertz)
ХXXXXXX
ХXXXX
frequency
ХXXXXXX
0.05973
ХXXXX 1.75е-08 ***
Here is a summary of the data:
Speed (body length/sec) Frequency (Hz)
Mean
0.6558
1.1334
SD
0.2267
0.3534
11
Correlation r2 0.9234
Swimming Speed
(Body Length per Second)
0.4
9'0
0.8](/v2/_next/image?url=https%3A%2F%2Fcontent.bartleby.com%2Fqna-images%2Fquestion%2F1207d66c-1291-4aaf-89f2-2ae1ecfc9f88%2F6854d881-de85-4875-abc7-f19a14e2c608%2Fk6zjqvn_processed.jpeg&w=3840&q=75)

Step by step
Solved in 2 steps with 1 images


