Which part of the article showed the Descriptive analytics? Predictive analytics? Prescriptive analytics?
Which part of the article showed the Descriptive analytics? Predictive analytics? Prescriptive analytics?

Purchasing and Supply Chain Management
6th Edition
ISBN:9781285869681
Author:Robert M. Monczka, Robert B. Handfield, Larry C. Giunipero, James L. Patterson
Publisher:Robert M. Monczka, Robert B. Handfield, Larry C. Giunipero, James L. Patterson
ChapterC: Cases
Section: Chapter Questions
Problem 1.7A: Avion, Inc. Susan Dey and Bill Mifflin, procurement managers at Avion, Inc., sat across from each...

Related questions

Question
Which part of the article showed the
- Descriptive analytics?
- Predictive analytics?
- Prescriptive analytics?
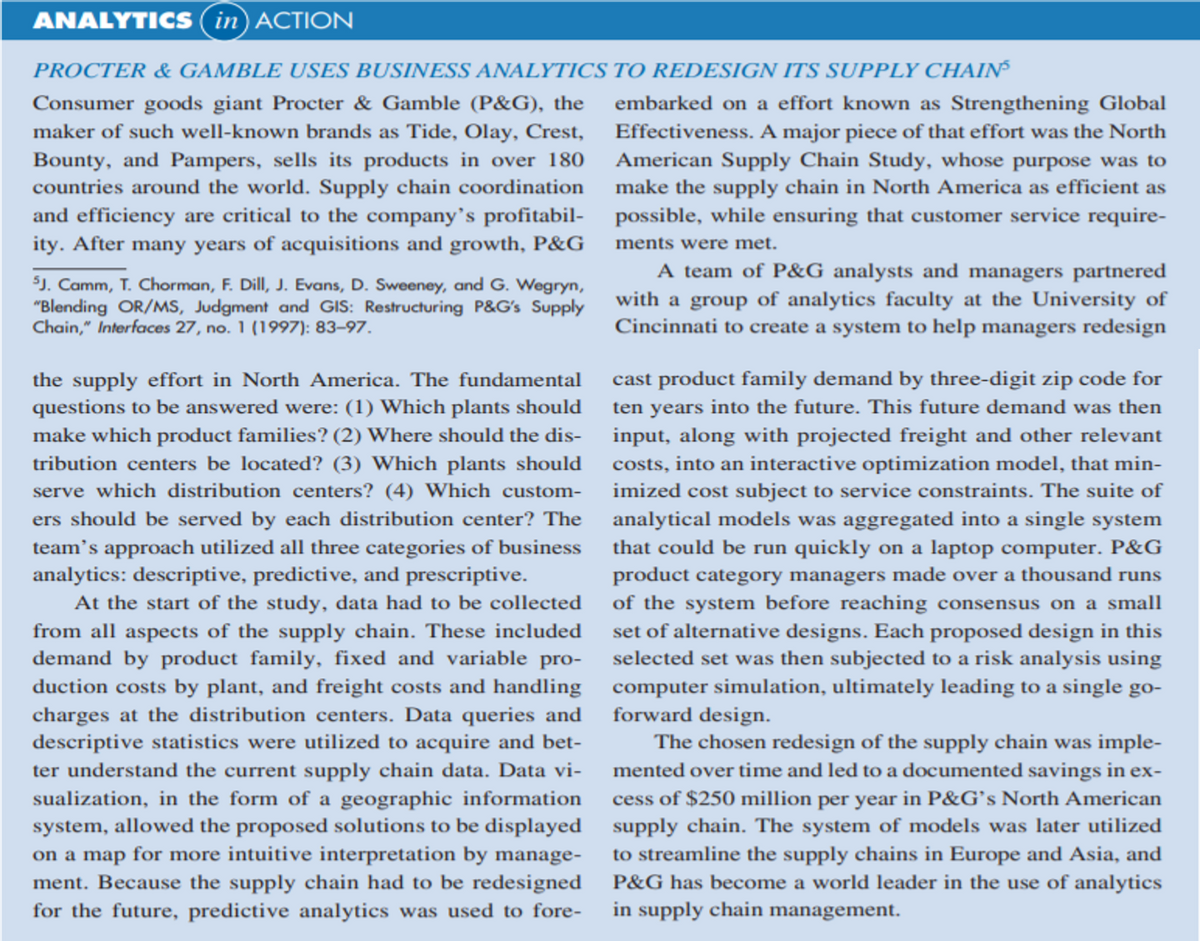
Transcribed Image Text:ANALYTICS (in) ACTION
PROCTER & GAMBLE USES BUSINESS ANALYTICS TO REDESIGN ITS SUPPLY CHAIN
Consumer goods giant Procter & Gamble (P&G), the
maker of such well-known brands as Tide, Olay, Crest,
embarked on a effort known as Strengthening Global
Effectiveness. A major piece of that effort was the North
American Supply Chain Study, whose purpose was to
make the supply chain in North America as efficient as
and efficiency are critical to the company's profitabil- possible, while ensuring that customer service require-
Bounty, and Pampers, sells its products in over 180
countries around the world. Supply chain coordination
ity. After many years of acquisitions and growth, P&G
ments were met.
SJ. Camm, T. Chorman, F. Dill, J. Evans, D. Sweeney, and G. Wegryn,
"Blending OR/MS, Judgment and GIS: Restructuring P&G's Supply
Chain," Interfaces 27, no. 1 (1997): 83-97.
A team of P&G analysts and managers partnered
with a group of analytics faculty at the University of
Cincinnati to create a system to help managers redesign
the supply effort in North America. The fundamental
cast product family demand by three-digit zip code for
ten years into the future. This future demand was then
input, along with projected freight and other relevant
questions to be answered were: (1) Which plants should
make which product families? (2) Where should the dis-
tribution centers be located? (3) Which plants should
serve which distribution centers? (4) Which custom-
costs, into an interactive optimization model, that min-
imized cost subject to service constraints. The suite of
analytical models was aggregated into a single system
that could be run quickly on a laptop computer. P&G
ers should be served by each distribution center? The
team's approach utilized all three categories of business
analytics: descriptive, predictive, and prescriptive.
At the start of the study, data had to be collected
from all aspects of the supply chain. These included
demand by product family, fixed and variable pro-
duction costs by plant, and freight costs and handling
charges at the distribution centers. Data queries and
descriptive statistics were utilized to acquire and bet-
ter understand the current supply chain data. Data vi-
sualization, in the form of a geographic information
system, allowed the proposed solutions to be displayed supply chain. The system of models was later utilized
on a map for more intuitive interpretation by manage-
ment. Because the supply chain had to be redesigned
for the future, predictive analytics was used to fore-
product category managers made over a thousand runs
of the system before reaching consensus on a small
set of alternative designs. Each proposed design in this
selected set was then subjected to a risk analysis using
computer simulation, ultimately leading to a single go-
forward design.
The chosen redesign of the supply chain was imple-
mented over time and led to a documented savings in ex-
cess of $250 million per year in P&G's North American
to streamline the supply chains in Europe and Asia, and
P&G has become a world leader in the use of analytics
in supply chain management.
Expert Solution
This question has been solved!
Explore an expertly crafted, step-by-step solution for a thorough understanding of key concepts.

This is a popular solution!

Trending now
This is a popular solution!

Step by step
Solved in 2 steps

Follow-up Questions
Read through expert solutions to related follow-up questions below.
Follow-up Question
Hi ,
I already know the meaning of descriptive , predictive and prescriptive. However , I have not read the whole case and I have no idea what are the approach the researchers have taken for these 3
Solution
Knowledge Booster


Learn more about
Need a deep-dive on the concept behind this application? Look no further. Learn more about this topic, operations-management and related others by exploring similar questions and additional content below.Recommended textbooks for you
Purchasing and Supply Chain Management
Operations Management
ISBN:
9781285869681
Author:
Robert M. Monczka, Robert B. Handfield, Larry C. Giunipero, James L. Patterson
Publisher:
Cengage Learning

Purchasing and Supply Chain Management
Operations Management
ISBN:
9781285869681
Author:
Robert M. Monczka, Robert B. Handfield, Larry C. Giunipero, James L. Patterson
Publisher:
Cengage Learning