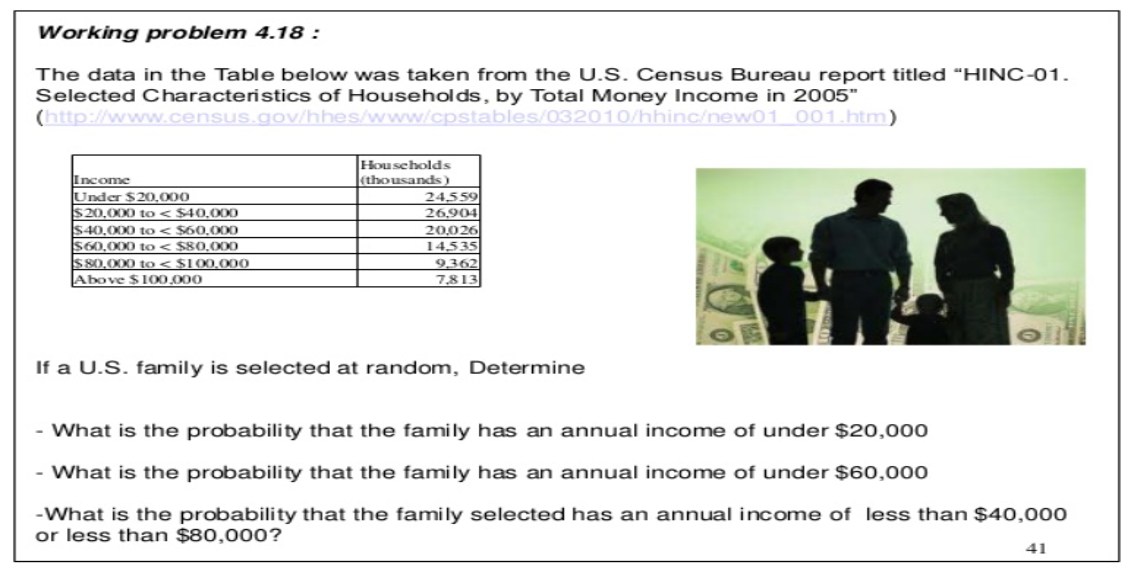
Working problem 4.18 : The data in the Table below was taken from the U.S. Census Bureau report titled “HINC-01. Selected Characteristics of Households, by Total Money Income in 2005" (http://www.census.gov/hhes/www/cpstables/032010/hhinc/new01 001.htm) Hou seholds (thousands) 24,559 Income Under $20,000 $20,000 to < $40,000 $40,000 to < $60,000 S60,000 to < $80,000 $80,000 to < $[ 00,000 Above $100,000 26,904 20,026 14,535 9,362 7,813 If a U.S. family is selected at random, Determine What is the probability that the family has an annual income of under $20,000 - What is the probability that the family has an annual income of under $60,000 -What is the probability that the family selected has an annual income of less than $40,000 or less than $80,000? 41
Working problem 4.18 : The data in the Table below was taken from the U.S. Census Bureau report titled “HINC-01. Selected Characteristics of Households, by Total Money Income in 2005" (http://www.census.gov/hhes/www/cpstables/032010/hhinc/new01 001.htm) Hou seholds (thousands) 24,559 Income Under $20,000 $20,000 to < $40,000 $40,000 to < $60,000 S60,000 to < $80,000 $80,000 to < $[ 00,000 Above $100,000 26,904 20,026 14,535 9,362 7,813 If a U.S. family is selected at random, Determine What is the probability that the family has an annual income of under $20,000 - What is the probability that the family has an annual income of under $60,000 -What is the probability that the family selected has an annual income of less than $40,000 or less than $80,000? 41

A First Course in Probability (10th Edition)
10th Edition
ISBN:9780134753119
Author:Sheldon Ross
Publisher:Sheldon Ross
Chapter1: Combinatorial Analysis
Section: Chapter Questions
Problem 1.1P: a. How many different 7-place license plates are possible if the first 2 places are for letters and...

Related questions
Question
Transcribed Image Text:Working problem 4.18 :
The data in the Table below was taken from the U.S. Census Bureau report titled “HINC-01.
Selected Characteristics of Households, by Total Money Income in 2005"
(http://www.census.gov/hhes/www/cpstables/032010/hhinc/new01 001.htm)
Income
Under $20,000
$20,000 to < $40,000
$40,000 to < $60,000
S60,000 to < $80,000
$80,000 to < $100,000
Above $100.000
Houscholds
(thousands)
24,559
26.904
20,026
14,535
9362
7,813
If a U.S. family is selected at random, Determine
What is the probability that the family has an annual income of under $20,000
What is the probability that the family has an annual income of under $60,000
-What is the probability that the family selected has an annual income of less than $40,000
or less than $80,000?
41
Expert Solution
This question has been solved!
Explore an expertly crafted, step-by-step solution for a thorough understanding of key concepts.

Step by step
Solved in 2 steps

Recommended textbooks for you
A First Course in Probability (10th Edition)
Probability
ISBN:
9780134753119
Author:
Sheldon Ross
Publisher:
PEARSON

A First Course in Probability (10th Edition)
Probability
ISBN:
9780134753119
Author:
Sheldon Ross
Publisher:
PEARSON