
Concept explainers
Write a mathematical scenario to describe each of the
Examples:
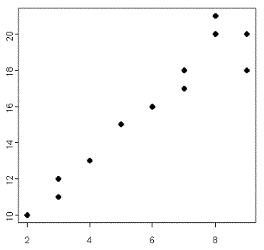
Graph #1) Here we are seeing a graph showing a positive-linear relationship between the variables. This could show the relationship between hours of study a student spends during a week (the x variable on the horizontal axis) and the exam grade (the y variable on the vertical axis, out of say 25 points) that student gets. We see here that the more hours a student spends studying the higher their exam grade is.
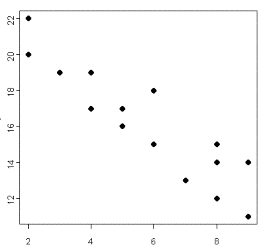
Graph #2) Here we are seeing a graph showing a negative-linear relationship between the variables. This could show the number of absences a student has over the course of a semester (the x variable on the horizontal axis) and their grade on a final exam (the y variable on the horizontal axis, out of 25 points). It would seem that as the number of absences increase the exam grade will fall.


Trending nowThis is a popular solution!
Step by stepSolved in 4 steps with 2 images

- Graph the following features: • Y-intercept =-2 • Slope = 4 %3D %3D y 10 7. 6. 4. 1. X. -10 -9 -8 -7 -6 -5 -4 -3 -2 -1 1 2 3 4 6. 9 10 -1 -2 -3 -4 -5 -6 -7 -8 6- -10arrow_forwardIn recent decades, the percentage of Americans who always wear their seatbelt has been on the rise. The following table contains data[1] between the years 1992 and 2011 (n, number of years after 1992) representing the percentage (P) of Americans who always wear seatbelts. The graph contains a plot of these points along with a “fitted” line, which models (or approximates) the data points. The equation for this line appears below the graph. n 0 4 8 12 16 19 P 70 75 79 83 87 91 P=1.07n+70.28 Estimate the percentage of Americans who always wear their seatbelt for 2002. Explain clearly and completely how you arrived at your answer. Estimate the percentage of Americans who always wear their seatbelt for 2012. Explain clearly and completely how you arrived at your answer. Estimate the percentage of Americans who always wear their seatbelt for 2024. Explain clearly and completely how you arrived at your answer. Comment on the…arrow_forwardPLEASE USE THE TABLE PROVIDED TO ANSWER THE QUESTION: John Doe Films is producing the next Batman movie. With the information available for Public Opinion and money Collected on Opening Day, what is the projected amount of money that will be collected if surveys indicate a public opinion of 8.5 for the new Batman movie? Can this projected amount of money be considered an accurate amount? Construct any plot(s)/graph(s) to support your answer.arrow_forward
- Could you show me how to work this problem: The no plot shows salaries for construction workers and teachers. If a person is making the median salary for a construction worker, they are making more than what percentage of teachers?arrow_forwardUse the data given in the three scenarios below to produce scatter plots, determine the type of model demonstrated in each example and then answer the questions based on the graph you created. Scenario 1 Rescue 911 In a rural community, fire and paramedic crews must service a large region. They often cover 2 or 3 towns several kilometres apart. These crews travel, on average, 70 km/h to their destination. The Chief of Station 42 wants to determine the time required to reach the patient's home (response time) for his region. The station is located next to the local hospital. The Chief knows the distances to each community that he services, including Deerborn, the furthest community, at 55 km away. Using the data below, create a scatter plot showing the relationship between distance to patient and response time. Distance to Patient (km) Response Time (minutes) 10 8.6 15 12.9 40 34.3 50 42.9 55 47.1arrow_forwardA study was done to look at the relationship between number of vacation days employees take each year and the number of sick days they take each year. The results of the survey are shown below. Vacation Days 2 7 0 3 2 9 15 3 8 0 11 Sick Days 10 3 6 5 4 5 0 4 2 11 0 Interpret the y-intercept in the context of the question: If an employee takes no vacation days, then that employee will take 8 sick days. The y-intercept has no practical meaning for this study. The best prediction for an employee who doesn't take any vacation days is that the employee will take 8 sick days. The average number of sick days is predicted to be 8arrow_forward
- a) Find the equation of the line which is the best fit for the data, with x equal to the number of years after 1999 and y equal to the millions of people b) Ise the model to estimate the number of people who took trips in 2008.arrow_forwardGiven data of height, x and stories, y is of six notable buildings in a city. height numbers: 768, 628, 518, 511, 491, 478 and stories numbers: 52, 48, 46, 43, 37, 35. What is the scope and y intercept of this? Round the scope to three decimal places as needed. Round the y-intercept to two decimal places as needed.arrow_forward#6. Basic Computation: Five-Number Summary, Interquartile Range 2 5 5 6 7 8 8 9 10 12 (a) Find the low, Q1, Median, Q3, and High. (b) Find the interquartile range (c) Make a box-and-whisker plot.arrow_forward
- The table gives the projections of the population, in millions, of a country's residents over age 16 for selected years from 2015 to 2060. Answer parts (a) through (e). Year 2015 2020 2025 2030 2035 a. Graph the data, with y equal to the population in millions and x equal to the number of years after 2010. Choose the correct graph below. All graphs have viewing window [0, 60] by [0, 400] with Xscl = 5 and Yscl = 50. OA. O B. Q Q Population (millions) 255.161 266.024 276.558 286.967 297.259 MooBook Air O C. b. Find a linear function that models the data, with y equal to the population in millions and x equal to the number of years after 2010. y=x+ (Type integers or decimals rounded to three decimal places as needed.) c. Graph the model and the data on the same axes and comment on the fit of the model to the data. Choose the correct graph below. All graphs have viewing window [0, 60] by [0, 400] with Xscl = 5 and Yscl = 50. OA. OB. G O C. Year 2040 2045 2050 2055 2060 O D. O D.…arrow_forwardI can do the scatter plot diagram I just need help With identifying the Y axis and the X access and the Form directions strength And outlierarrow_forwardRefer to the images to solve the problems.arrow_forward
- Advanced Engineering MathematicsAdvanced MathISBN:9780470458365Author:Erwin KreyszigPublisher:Wiley, John & Sons, IncorporatedNumerical Methods for EngineersAdvanced MathISBN:9780073397924Author:Steven C. Chapra Dr., Raymond P. CanalePublisher:McGraw-Hill EducationIntroductory Mathematics for Engineering Applicat...Advanced MathISBN:9781118141809Author:Nathan KlingbeilPublisher:WILEY
- Mathematics For Machine TechnologyAdvanced MathISBN:9781337798310Author:Peterson, John.Publisher:Cengage Learning,


