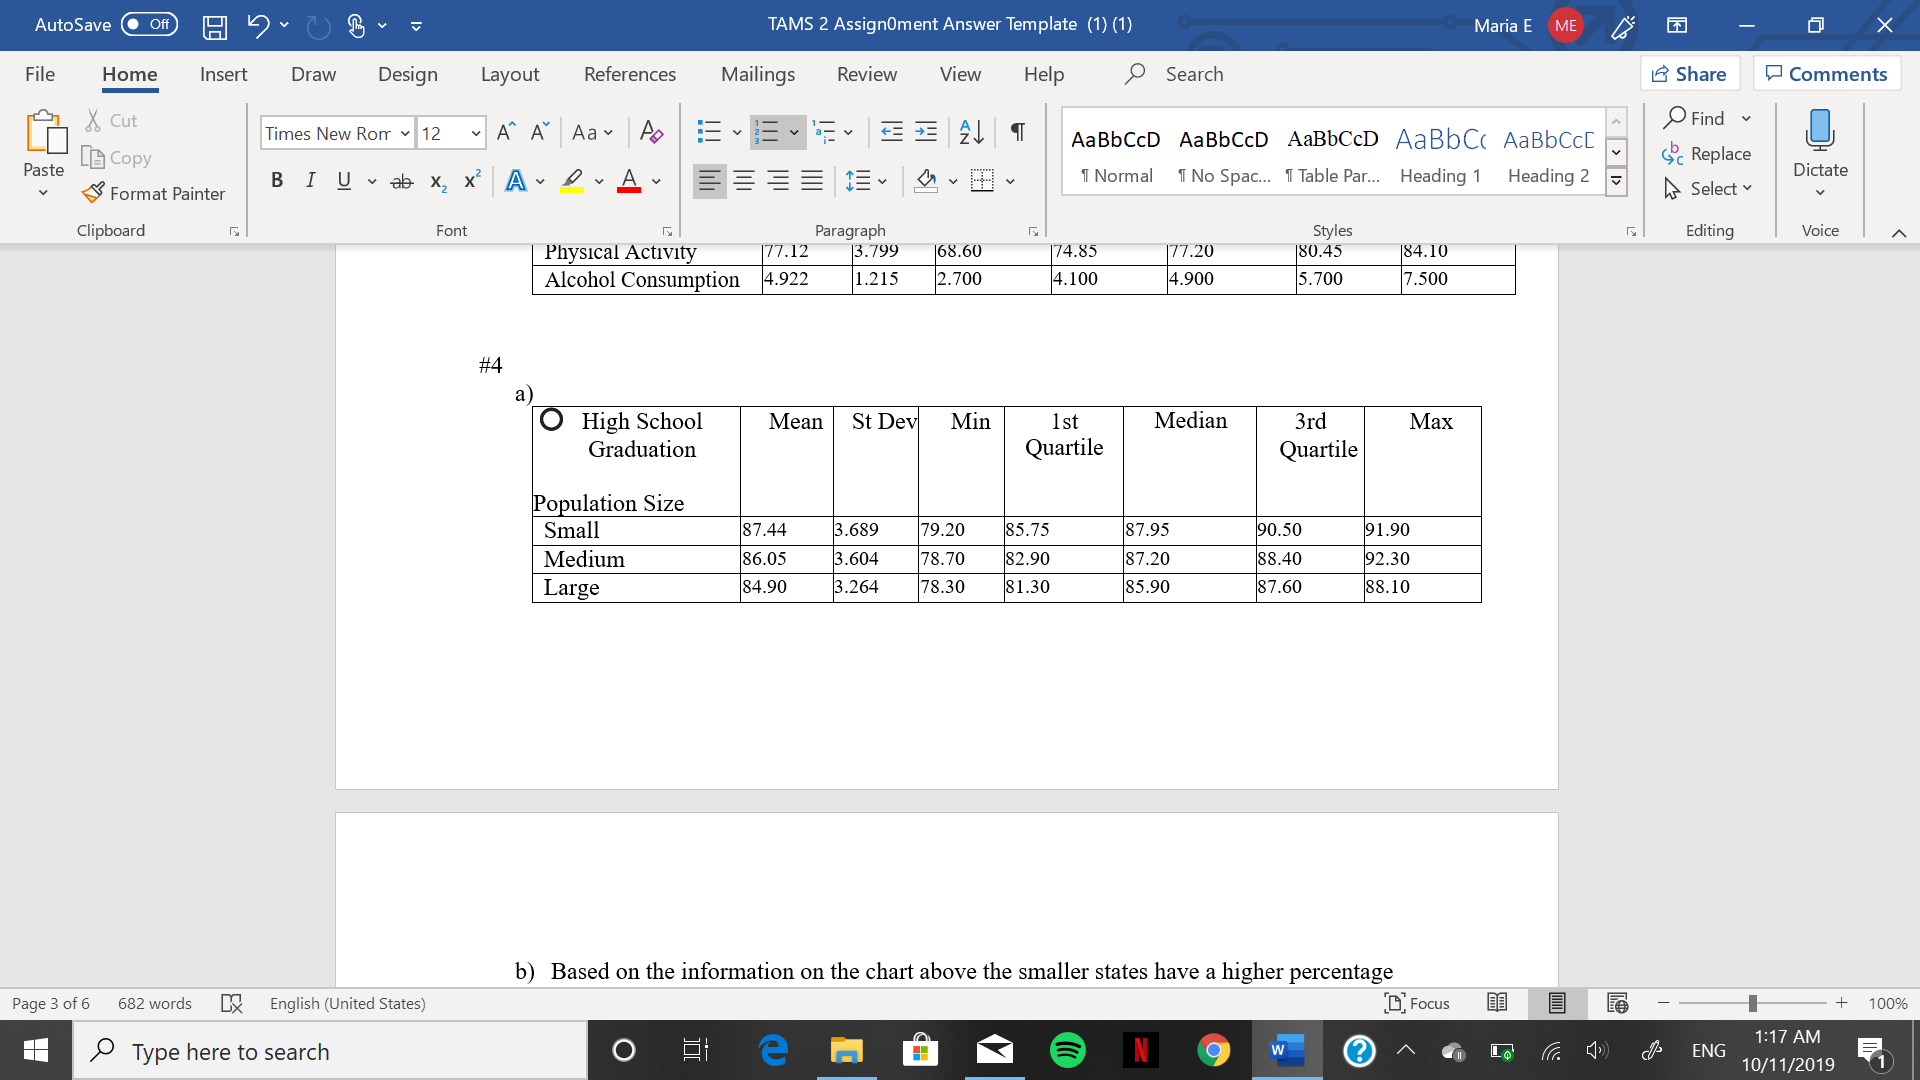
X TAMS 2 Assign0ment Answer Template (1) (1) AutoSave Maria E Off МE Mailings Review Help Search Share File Design References View Home Insert Draw Layout Comments Find Cut AT A AAa Times New Rom 12 АаBbCcD AaBЬСcD AaBbСcD AaBbCc АаBbCc‑ Replace L Copy Paste Dictate T Normal No Spa... Table Par... Heading 1 Heading 2 В I U ab х, х* А Select Format Painter Clipboard Paragraph 13.799 Styles 180.45 Editing Voice Font Physical Activity Alcohol Consumption 68.60 177.20 184.10 77.12 |74.85 7.500 1.215 2.700 5.700 4.922 4.100 4.900 #4 а High School Graduation St Dev Median Mean Min 3rd 1st Маx Quartile Quartile Population Size Small 85.75 87.44 3.689 79.20 87.95 90.50 91.90 78.70 82.90 87.20 88.40 92.30 88.10 Medium 86.05 3.604 81.30 85.90 84.90 3.264 78.30 87.60 Large b) Based on the information on the chart above the smaller states have a higher percentage L Focus 682 words English (United States) Page 3 of 6 100% 1:17 AM Type here to search ENG W 1 10/11/2019
Inverse Normal Distribution
The method used for finding the corresponding z-critical value in a normal distribution using the known probability is said to be an inverse normal distribution. The inverse normal distribution is a continuous probability distribution with a family of two parameters.
Mean, Median, Mode
It is a descriptive summary of a data set. It can be defined by using some of the measures. The central tendencies do not provide information regarding individual data from the dataset. However, they give a summary of the data set. The central tendency or measure of central tendency is a central or typical value for a probability distribution.
Z-Scores
A z-score is a unit of measurement used in statistics to describe the position of a raw score in terms of its distance from the mean, measured with reference to standard deviation from the mean. Z-scores are useful in statistics because they allow comparison between two scores that belong to different normal distributions.
Do larger states have a higher graduation rate? If not explain why

Trending now
This is a popular solution!
Step by step
Solved in 2 steps


