X Y 1 2.5 4.4 1 2 13.6 4 20.7 4 25.6 36.2 5 Using the formulas for linear regression, find the constants for the regression model given by y aoa1. Then use the linear model to determine the expected value of Y when x 3
X Y 1 2.5 4.4 1 2 13.6 4 20.7 4 25.6 36.2 5 Using the formulas for linear regression, find the constants for the regression model given by y aoa1. Then use the linear model to determine the expected value of Y when x 3

Functions and Change: A Modeling Approach to College Algebra (MindTap Course List)
6th Edition
ISBN:9781337111348
Author:Bruce Crauder, Benny Evans, Alan Noell
Publisher:Bruce Crauder, Benny Evans, Alan Noell
Chapter5: A Survey Of Other Common Functions
Section5.6: Higher-degree Polynomials And Rational Functions
Problem 1TU: The following fictitious table shows kryptonite price, in dollar per gram, t years after 2006. t=...

Related questions
Question
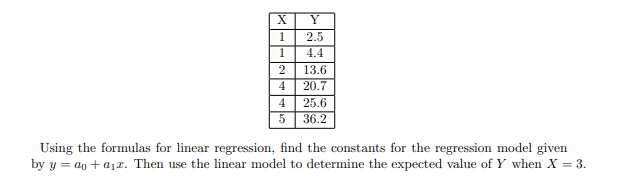
Transcribed Image Text:X
Y
1
2.5
4.4
1
2
13.6
4
20.7
4
25.6
36.2
5
Using the formulas for linear regression, find the constants for the regression model given
by y aoa1. Then use the linear model to determine the expected value of Y when x 3
Expert Solution
This question has been solved!
Explore an expertly crafted, step-by-step solution for a thorough understanding of key concepts.

This is a popular solution!

Trending now
This is a popular solution!

Step by step
Solved in 3 steps with 3 images

Recommended textbooks for you
Functions and Change: A Modeling Approach to Coll…
Algebra
ISBN:
9781337111348
Author:
Bruce Crauder, Benny Evans, Alan Noell
Publisher:
Cengage Learning

Glencoe Algebra 1, Student Edition, 9780079039897…
Algebra
ISBN:
9780079039897
Author:
Carter
Publisher:
McGraw Hill

College Algebra
Algebra
ISBN:
9781305115545
Author:
James Stewart, Lothar Redlin, Saleem Watson
Publisher:
Cengage Learning
Functions and Change: A Modeling Approach to Coll…
Algebra
ISBN:
9781337111348
Author:
Bruce Crauder, Benny Evans, Alan Noell
Publisher:
Cengage Learning
Glencoe Algebra 1, Student Edition, 9780079039897…
Algebra
ISBN:
9780079039897
Author:
Carter
Publisher:
McGraw Hill
College Algebra
Algebra
ISBN:
9781305115545
Author:
James Stewart, Lothar Redlin, Saleem Watson
Publisher:
Cengage Learning