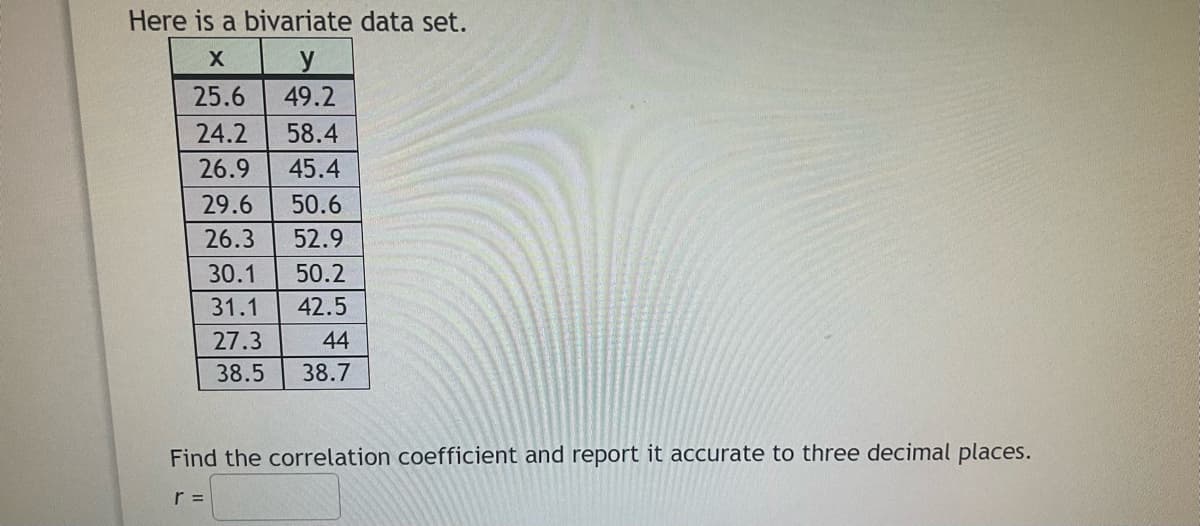
X y 25.6 49.2 24.2 58.4 26.9 45.4 29.6 50.6 26.3 52.9 30.1 50.2 31.1 42.5 27.3 44 38.5 38.7 Find the correlation coefficient and report it accurate to three decimal places.


Q: A grocery store manager did a study to look at the relationship between the amount of time (in…
A: Note: Hi, thank you for the question. As per our company guideline we are supposed to answer only…
Q: A biologist looked at the relationship between number of seeds a plant produces and the percent of…
A: Since you have posted a question with multiple subparts, we will solve first three subparts for you.…
Q: A biologist looked at the relationship between number of seeds a plant produces and the percent of…
A: You have posted multiple sub parts. As per Bartleby rules, I am solving 3 sub parts. Please re-post…
Q: A grocery store manager did a study to look at the relationship between the amount of time (in…
A: Note: As per the guidelines only three sub parts can be answered. Kindly, repost for other subparts.…
Q: What is the relationship between the amount of time statistics students study per week and their…
A: a.Correlation coefficient(r):
Q: A grocery store manager did a study to look at the relationship between the amount of time (in…
A: Dear students as per guidelines we answer the first question mentioned subparts only. Please post…
Q: A biologist looked at the relationship between number of seeds a plant produces and the percent of…
A: Note: Thank you for the question. Since multiple subparts are posted, according to our policy, we…
Q: 1. The time x in years that an employee spent at a company and the employee's hourly pay, y, for 5…
A:
Q: y 8 -37 28 -38 68 -24 19 77 68 -69 50 -53 28 190 26 165 17 124 Find the correlation coefficient and…
A: We have given that, The data set are : X :- 8, 28, 68, 19, 68, 50, 28, 26, 17 Y:- -37, -38, -24,…
Q: Give interpretation of the below?Correlation ρxy≈0
A:
Q: Párt A equation for the line of best fit and the correlation coefficient for the data from 1940…
A: Correlation: It is the extent of the linear relationship between two variables. Fitted value : A…
Q: x y 23.2 516.8 29.6 -1729.2 37.5 343.1 19.3 3124.3 57.7 1938.3 18.3 -1530.7 20.4 2383.3 30.8 259.6…
A: Follow the steps below to get the correlation coefficient in excel: 1) Import the data in the excel…
Q: A grocery store manager did a study to look at the relationship between the amount of time (in…
A: Given information: The data is provided as: Time (X) Money (Y) 21 63 17 51 28 109 13 49…
Q: A grocery store manager did a study to look at the relationship between the amount of time (in…
A: The correlation coefficient is used to measure the association between two variables. The…
Q: The owner of Cypres Recordings investigated the relationship between sales (y) and the amount spent…
A: Given data isx1=12,x2=26,x3=17y1=29,y2=30,y3=18
Q: Q17 Which value of the following values of r indicates the strongest correlation? 0.4 0 -0.65…
A: Correlation coefficients:- The correlation coefficients measures the direction & strength of a…
Q: Here is a bivariate data set. y 70 74 -40 80 -13 81 143 69 -13 80 62 75 -11 80 41 77 86 73 -40 Find…
A: The independent variable is X. The dependent variable is Y. The given data represents simple linear…
Q: Calculate Karl Pearson' s coefficient of correlation from the following data : 31 24 28 18 20 X: 6.…
A:
Q: Annual high temperatures in a certain location have been tracked for several years. Let X represent…
A: Correlation coefficient - r: The Karl Pearson’s product-moment correlation coefficient or simply,…
Q: Just by looking at the scatter plot, estimate the value of the Pearson correlation: O -0.70 to -0.90…
A:
Q: 9. 260 280 360 360 360 640 750 770 790 1110 y 150 175 250 280 237 450 500 520 530 823 Is there a…
A: Given that x 260 280 360 360 360 640 750 770 790 1110 y 150 175 250 280 237 450 500 520 530…
Q: Calculate Karl Pearson' s coefficient of correlation from the following data : Х: 6. 8. 12 15 18 20…
A:
Q: Which of the following r-values represents the strongest correlation? A. 0.55 O B. 0.45 C. 0.65 D.…
A: The correlation coefficient ranges from -1 to +1 Negative symbol indicates negatively correlated and…
Q: When interpreting a correlation coefficient of 0.34, you would say that there is a linear…
A: Based on the r value, we can consider whether the linear relationship between two variables are weak…
Q: What is the relationship between the number of minutes per day a woman spends talking on the phone…
A: Remaining part is f
Q: A set of n = 25 pairs of scores (X and Y values) has a Pearson correlation of r = 0.80. How much of…
A:
Q: A researcher found that chocolate consumption and stress are correlated so that a decrease in…
A: Defination: Negative Correlation : If the change in the value of one variable results in the…
Q: A biologist looked at the relationship between number of seeds a plant produces and the percent of…
A: Since you have posted a question with multiple sub-parts, we will solve first three sub- parts for…
Q: Charlie wants to know if a linear relationship exists between the number of toys a child has and…
A: Solution: The sample Pearson's product moment correlation coefficient r can be used to determine the…
Q: Based on what you know about correlation, which one of the following statements must be incorrect? O…
A: Correlation shows the relation between the two variables. It can shows positive and negative…
Q: Use the paired data below to test the claim that there is a correlation between x and y, using…
A: We have given that, The data set are, X :- 46.6, 27.7, 43.1, 29, 34.8 Y:- 8, 8, 3,…
Q: If you did a hand calculation for a Spearman correlation coefficient and obtained r= 1.3 you would…
A: We know that the Spearman correlation coefficient is a statistical tool to measure the strength of…
Q: What is the value of the correlation coefficient for the data in the table? y 2696 1198 2099 11 3793…
A: Given Correlation coefficient (r) Correct option is B
Q: A value of r close to 0 indicates what type of linear correlation between the two variables? a.…
A: A value of r close to 0 indicates that either variables have no correlation or weak correlation.
Q: Which of the following coefficient of correlation implies moderate positive correlation? 0.5 to 0.7…
A: Given : correlation coefficient is denoted by r
Q: Which of the values is the best estimate of the correlation coefficient for the line of best fit…
A: In the scatterplot, as the value of variable on horizontal axis increases the values of variable on…
Q: Which of the following best describe a -0.85 correlation between two sets of data? A. When one…
A: Here, we have given that, Correlation coefficient = -0.85 Which implies that, When one series…
Q: Run a regression analysis on the following bivariate set of data with y as the response variable.…
A: In order to obtain the least square regression line, first perform regression analysis on the data.…
Q: Assuming that ss, is constant, which of the following correlations would have the smallest…
A: GivenSSy : is constantWe want to choose correlation which would have the smallest SSresidual. The…
Q: A biologist looked at the relationship between number of seeds a plant produces and the percent of…
A:
Q: Which of the following values of the correlation coefficient indicates the weakest relationship…
A: Given, the values of the correlation coefficient, To find the correlation coefficient which…
Q: A biologist looked at the relationship between number of seeds a plant produces and the percent of…
A: Seeds(x) Sprout(y) xy x2 y2 63 39.5 2488.5 3969 1560.25 49 47.5 2327.5 2401 2256.25 40…
Q: If the correlation coefficient is 0.930, what is the unexplained variation
A:
Q: A grocery store manager did a study to look at the relationship between the amount of time (in…
A: Note- As per company policy we cannot answer more than 3 sub-parts. For other parts you have to make…
Q: Run a regression analysis on the following bivariate set of data with y as the response variable.…
A:
Q: 5. Which of the following Pearson correlations shows the greatest strength or consistency of…
A: From given information we know that , Correlation (r) value is near by ±1 has the greatest strength…
Q: A biologist looked at the relationship between number of seeds a plant produces and the percent of…
A: F ) X-Seeds produced Y-Sprout percent
Q: Which plot indicates a correlation of 0.7? 150 10
A: There are two types of correlation: positive correlation and negative correlation Two variables are…
Q: A grocery store manager did a study to look at the relationship between the amount of time (in…
A: In this case, the amount of money spent by the customer is predicted on the basis of the amount of…
Q: The maximum weights (in kilograms) for which one repetition of a half-squat can be performed and the…
A:

Step by step
Solved in 2 steps with 2 images
