year is October-September. All välues CAD Millions. 2021 2020 2019 2018 201 5-year trer Sales/Revenue 18,283 17,998 16,768 14,383 13,175 Sales Growth 1.59% 7.34% 16.58% 9.17% Cost of Goods Sold (COGS) incl. D&A 16,193 15,929 14,691 12,653 11,566 COGS excluding D&A 15,715 15,468 14,405 12,419 11,371 Depreciation & Amortization Expense 478 462 286 233 194 Depreciation 400 387 210 185 164 Amortization of Intangibles 78 5ל 75 48 30 COGS Growth 1.66% 8.43% 16.11% 9.40% Gross Income 2,090 2,068 2,077 1,731 1,610 Gross Income Growth 1.05% -0.41% 19.99% 7.52% Gross Profit Margin 11.43% SG&A Expense 835 837 1,009 876 842 Other SG&A 837 1,009 876 842 SGA Growth -0.19% 17.06% 15.23% 3.98% Other Operating Expense 11 EBIT 1,255 1,231 1,068 844 768 Unusual Expense 37 (175) (5) 2.
year is October-September. All välues CAD Millions. 2021 2020 2019 2018 201 5-year trer Sales/Revenue 18,283 17,998 16,768 14,383 13,175 Sales Growth 1.59% 7.34% 16.58% 9.17% Cost of Goods Sold (COGS) incl. D&A 16,193 15,929 14,691 12,653 11,566 COGS excluding D&A 15,715 15,468 14,405 12,419 11,371 Depreciation & Amortization Expense 478 462 286 233 194 Depreciation 400 387 210 185 164 Amortization of Intangibles 78 5ל 75 48 30 COGS Growth 1.66% 8.43% 16.11% 9.40% Gross Income 2,090 2,068 2,077 1,731 1,610 Gross Income Growth 1.05% -0.41% 19.99% 7.52% Gross Profit Margin 11.43% SG&A Expense 835 837 1,009 876 842 Other SG&A 837 1,009 876 842 SGA Growth -0.19% 17.06% 15.23% 3.98% Other Operating Expense 11 EBIT 1,255 1,231 1,068 844 768 Unusual Expense 37 (175) (5) 2.

Survey of Accounting (Accounting I)
8th Edition
ISBN:9781305961883
Author:Carl Warren
Publisher:Carl Warren
Chapter9: Metric-analysis Of Financial Statements
Section: Chapter Questions
Problem 9.4.6P: Twenty metrics of liquidity, solvency, and profitability The comparative financial statements of...

Related questions
Question
100%
Perform a horizontal analysis of the company
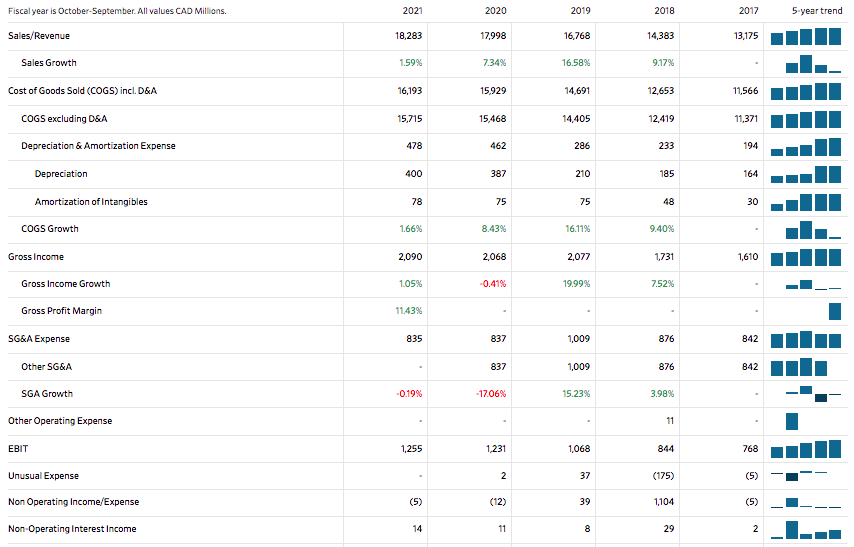
Transcribed Image Text:Fiscal year is October-September. All values CAD Millions.
2021
2020
2019
2018
2017
5-year trend
Sales/Revenue
18,283
17,998
16,768
14,383
13,175
Sales Growth
1.59%
7.34%
16.58%
9.17%
Cost of Goods Sold (COGS) incl. D&A
16,193
15,929
14,691
12,653
11,566
COGS excluding D&A
15,715
15,468
14,405
12,419
11,371
Depreciation & Amortization Expense
478
462
286
233
194
Depreciation
400
387
210
185
164
Amortization of Intangibles
78
75
75
48
30
COGS Growth
1.66%
8.43%
16.11%
9.40%
Gross Income
2,090
2,068
2,077
1,731
1,610
Gross Income Growth
1.05%
-0.41%
19.99%
7.52%
Gross Profit Margin
11.43%
SG&A Expense
835
837
1,009
876
842
Other SG&A
837
1,009
876
842
SGA Growth
-0.19%
-17.06%
15.23%
3.98%
Other Operating Expense
11
EBIT
1,255
1,231
1,068
844
768
Unusual Expense
2
37
(175)
(5)
Non Operating Income/Expense
(5)
(12)
39
1,104
(5)
Non-Operating Interest Income
14
11
8
29
2
co
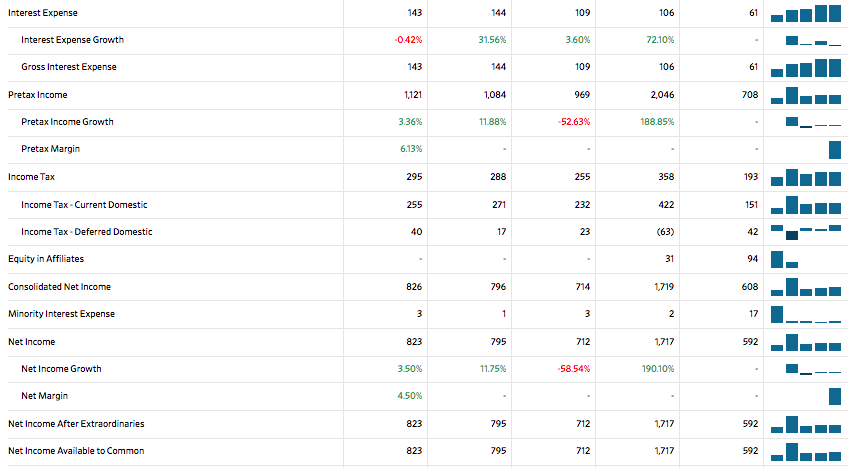
Transcribed Image Text:Interest Expense
143
144
109
106
61
Interest Expense Growth
-0.42%
31.56%
3.60%
72.10%
Gross Interest Expense
143
144
109
106
61
Pretax Income
1,121
1,084
969
2,046
708
Pretax Income Growth
3.36%
11.88%
-52.63%
188.85%
Pretax Margin
6.13%
Income Tax
295
288
255
358
193
Income Tax - Current Domestic
255
271
232
422
151
Income Tax - Deferred Domestic
40
17
23
(63)
42
Equity in Affiliates
31
94
Consolidated Net Income
826
796
714
1,719
608
Minority Interest Expense
3
1
3
2
17
Net Income
823
795
712
1,717
592
Net Income Growth
3.50%
11.75%
-58.54%
190.10%
Net Margin
4.50%
Net Income After Extraordinaries
823
795
712
1,717
592
Net Income Available to Common
823
795
712
1,717
592
Expert Solution
This question has been solved!
Explore an expertly crafted, step-by-step solution for a thorough understanding of key concepts.

Step by step
Solved in 3 steps with 2 images

Knowledge Booster


Learn more about
Need a deep-dive on the concept behind this application? Look no further. Learn more about this topic, accounting and related others by exploring similar questions and additional content below.Recommended textbooks for you
Survey of Accounting (Accounting I)
Accounting
ISBN:
9781305961883
Author:
Carl Warren
Publisher:
Cengage Learning

Intermediate Accounting: Reporting And Analysis
Accounting
ISBN:
9781337788281
Author:
James M. Wahlen, Jefferson P. Jones, Donald Pagach
Publisher:
Cengage Learning

Financial Accounting
Accounting
ISBN:
9781337272124
Author:
Carl Warren, James M. Reeve, Jonathan Duchac
Publisher:
Cengage Learning
Survey of Accounting (Accounting I)
Accounting
ISBN:
9781305961883
Author:
Carl Warren
Publisher:
Cengage Learning
Intermediate Accounting: Reporting And Analysis
Accounting
ISBN:
9781337788281
Author:
James M. Wahlen, Jefferson P. Jones, Donald Pagach
Publisher:
Cengage Learning
Financial Accounting
Accounting
ISBN:
9781337272124
Author:
Carl Warren, James M. Reeve, Jonathan Duchac
Publisher:
Cengage Learning

Managerial Accounting: The Cornerstone of Busines…
Accounting
ISBN:
9781337115773
Author:
Maryanne M. Mowen, Don R. Hansen, Dan L. Heitger
Publisher:
Cengage Learning

Cornerstones of Financial Accounting
Accounting
ISBN:
9781337690881
Author:
Jay Rich, Jeff Jones
Publisher:
Cengage Learning

Financial And Managerial Accounting
Accounting
ISBN:
9781337902663
Author:
WARREN, Carl S.
Publisher:
Cengage Learning,