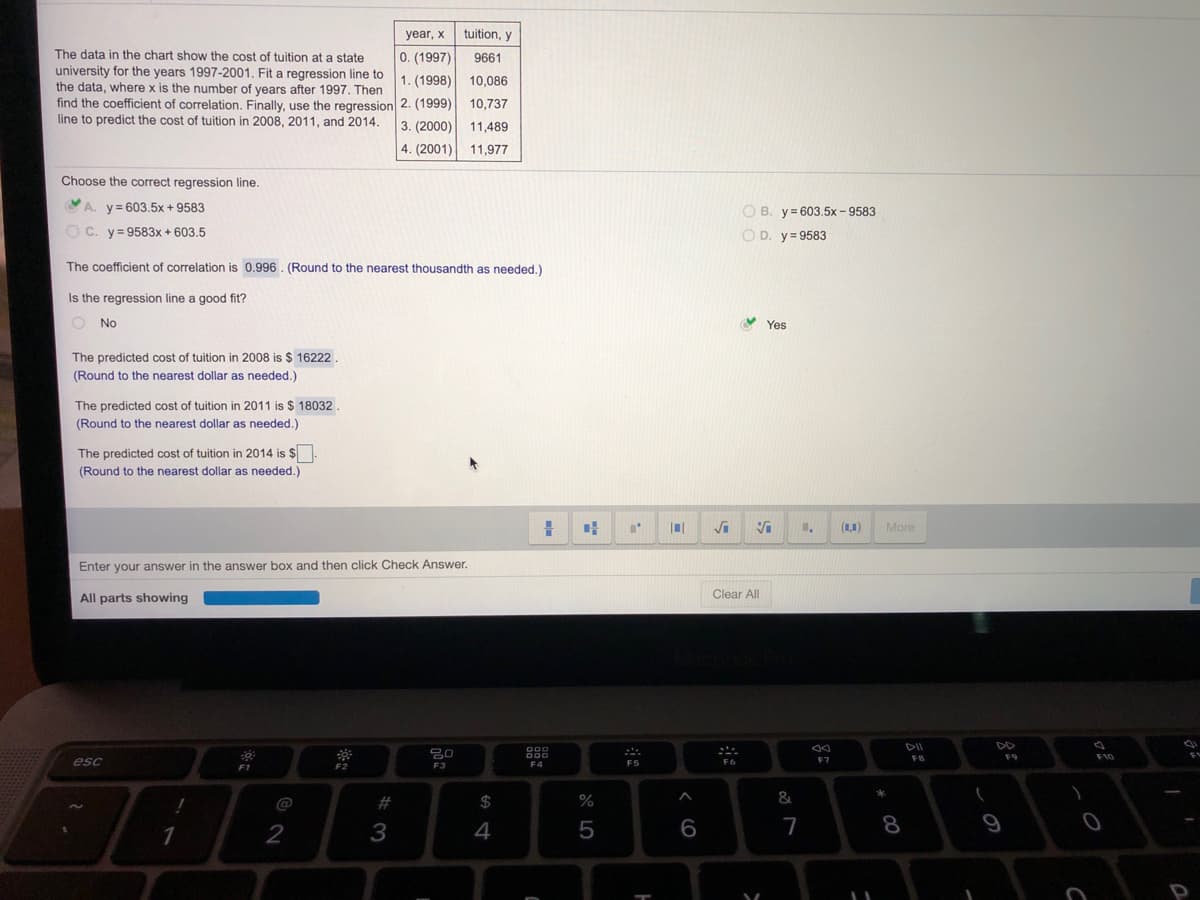
year, x tuition, y The data in the chart show the cost of tuition at a state university for the years 1997-2001. Fit a regression line to the data, where x is the number of years after 1997. Then find the coefficient of correlation. Finally, use the regression 2. (1999) line to predict the cost of tuition in 2008, 2011, and 2014. 0. (1997) 9661 1. (1998) 10,086 10,737 3. (2000) 11,489 4. (2001) 11,977 Choose the correct regression line. A. y= 603.5x + 9583 O B. y=603.5x-9583 O C. y=9583x + 603.5 O D. y=9583 The coefficient of correlation is 0.996. (Round to the nearest thousandth as needed.) Is the regression line a good fit? O No V Yes The predicted cost of tuition in 2008 is $ 16222. (Round to the nearest dollar as needed.) The predicted cost of tuition in 2011 is $ 18032. (Round to the nearest dollar as needed.) The predicted cost of tuition in 2014 is $ (Round to the nearest dollar as needed.)


Correlation
Correlation defines a relationship between two independent variables. It tells the degree to which variables move in relation to each other. When two sets of data are related to each other, there is a correlation between them.
Linear Correlation
A correlation is used to determine the relationships between numerical and categorical variables. In other words, it is an indicator of how things are connected to one another. The correlation analysis is the study of how variables are related.
Regression Analysis
Regression analysis is a statistical method in which it estimates the relationship between a dependent variable and one or more independent variable. In simple terms dependent variable is called as outcome variable and independent variable is called as predictors. Regression analysis is one of the methods to find the trends in data. The independent variable used in Regression analysis is named Predictor variable. It offers data of an associated dependent variable regarding a particular outcome.


Trending now
This is a popular solution!

Step by step
Solved in 2 steps with 3 images


