years 2008 to 2015 in the table below Complete parts (a) through (d). Year Index 2008 83 2009 2010 2011 2012 60 2013 2014 2015 100 45 61 62 57 79 OPlot the data with x8 coresponding to the year 2008 A. OB. OD. Ay 120 AY 120 120 704 70 70- 70 20 10 13 16 20- 20- 10 13 Use quartic regression to find a fourth-order polynomial function to) that models these data 10 10 13 Round to the
years 2008 to 2015 in the table below Complete parts (a) through (d). Year Index 2008 83 2009 2010 2011 2012 60 2013 2014 2015 100 45 61 62 57 79 OPlot the data with x8 coresponding to the year 2008 A. OB. OD. Ay 120 AY 120 120 704 70 70- 70 20 10 13 16 20- 20- 10 13 Use quartic regression to find a fourth-order polynomial function to) that models these data 10 10 13 Round to the

Glencoe Algebra 1, Student Edition, 9780079039897, 0079039898, 2018
18th Edition
ISBN:9780079039897
Author:Carter
Publisher:Carter
Chapter10: Statistics
Section10.1: Measures Of Center
Problem 4GP

Related questions
Question
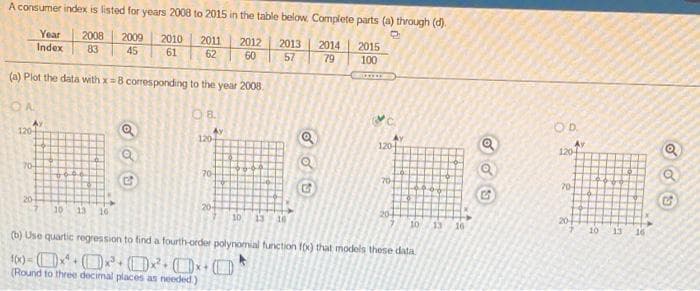
Transcribed Image Text:A consumer index is listed for years 2008 to 2015 in the table below Complete parts (a) through (d).
Year
2008
2009
2010
2011
62
Index
2012
2013
2014
2015
83
45
61
60
57
79
100
(a) Plot the data with x= B corresponding to the year 2008.
OA
O 8.
OD.
120
AV
120
AY
120
Ay
120
70-
70
70-
70-
20
10
13
10
20-
10 13
20-
16
20
10
13
16
(b) Use quartic regression to find a fourth-order polynomial function fx) that models these data
10 13
16
(Round to three decimal places as needed)
Expert Solution
This question has been solved!
Explore an expertly crafted, step-by-step solution for a thorough understanding of key concepts.

This is a popular solution!

Trending now
This is a popular solution!

Step by step
Solved in 2 steps with 2 images

Recommended textbooks for you
Glencoe Algebra 1, Student Edition, 9780079039897…
Algebra
ISBN:
9780079039897
Author:
Carter
Publisher:
McGraw Hill
Glencoe Algebra 1, Student Edition, 9780079039897…
Algebra
ISBN:
9780079039897
Author:
Carter
Publisher:
McGraw Hill