À shareholders' group is lodging a protest against your company. The shareholders group claimed that the mean tenure for a chief exective office (CEO) was at least 9 years. A survey of 98 companies reported in The Wall Street Journal found a sample mean tenure of 8.7 years for CEOS with a
À shareholders' group is lodging a protest against your company. The shareholders group claimed that the mean tenure for a chief exective office (CEO) was at least 9 years. A survey of 98 companies reported in The Wall Street Journal found a sample mean tenure of 8.7 years for CEOS with a

MATLAB: An Introduction with Applications
6th Edition
ISBN:9781119256830
Author:Amos Gilat
Publisher:Amos Gilat
Chapter1: Starting With Matlab
Section: Chapter Questions
Problem 1P

Related questions
Topic Video
Question
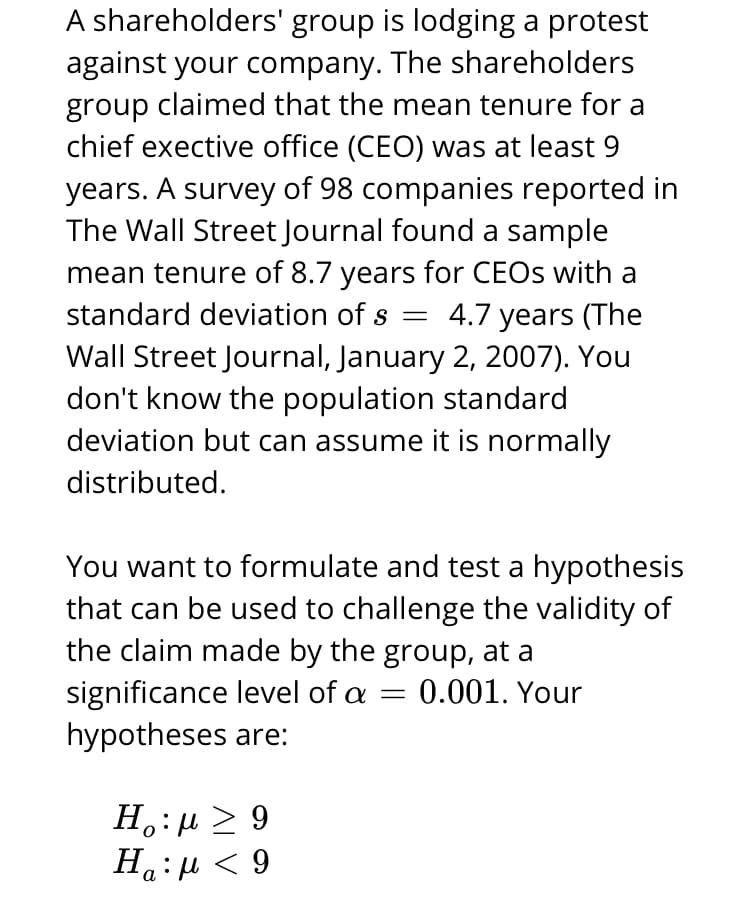
Transcribed Image Text:A shareholders' group is lodging a protest
against your company. The shareholders
group claimed that the mean tenure for a
chief exective office (CEO) was at least 9
years. A survey of 98 companies reported in
The Wall Street Journal found a sample
mean tenure of 8.7 years for CEOS with a
standard deviation of s = 4.7 years (The
Wall Street Journal, January 2, 2007). You
don't know the population standard
deviation but can assume it is normally
distributed.
You want to formulate and test a hypothesis
that can be used to challenge the validity of
the claim made by the group, at a
significance level of a
hypotheses are:
0.001. Your
H.:µ > 9
Ha:µ < 9
а
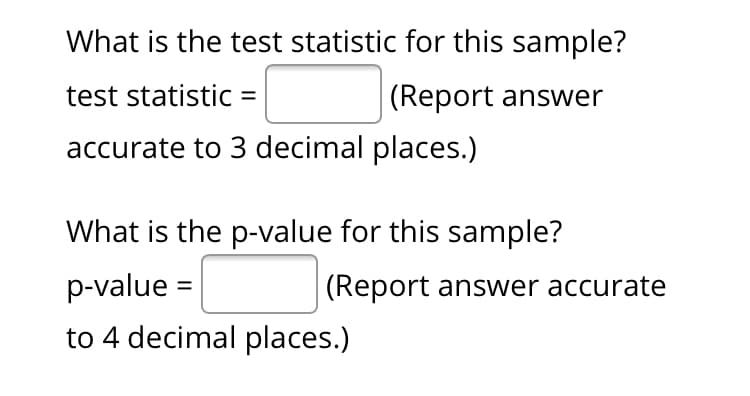
Transcribed Image Text:What is the test statistic for this sample?
test statistic =
(Report answer
accurate to 3 decimal places.)
What is the p-value for this sample?
p-value =
(Report answer accurate
to 4 decimal places.)
Expert Solution
This question has been solved!
Explore an expertly crafted, step-by-step solution for a thorough understanding of key concepts.

This is a popular solution!

Trending now
This is a popular solution!

Step by step
Solved in 2 steps with 1 images

Knowledge Booster


Learn more about
Need a deep-dive on the concept behind this application? Look no further. Learn more about this topic, statistics and related others by exploring similar questions and additional content below.Recommended textbooks for you
MATLAB: An Introduction with Applications
Statistics
ISBN:
9781119256830
Author:
Amos Gilat
Publisher:
John Wiley & Sons Inc

Probability and Statistics for Engineering and th…
Statistics
ISBN:
9781305251809
Author:
Jay L. Devore
Publisher:
Cengage Learning

Statistics for The Behavioral Sciences (MindTap C…
Statistics
ISBN:
9781305504912
Author:
Frederick J Gravetter, Larry B. Wallnau
Publisher:
Cengage Learning
MATLAB: An Introduction with Applications
Statistics
ISBN:
9781119256830
Author:
Amos Gilat
Publisher:
John Wiley & Sons Inc
Probability and Statistics for Engineering and th…
Statistics
ISBN:
9781305251809
Author:
Jay L. Devore
Publisher:
Cengage Learning
Statistics for The Behavioral Sciences (MindTap C…
Statistics
ISBN:
9781305504912
Author:
Frederick J Gravetter, Larry B. Wallnau
Publisher:
Cengage Learning

Elementary Statistics: Picturing the World (7th E…
Statistics
ISBN:
9780134683416
Author:
Ron Larson, Betsy Farber
Publisher:
PEARSON

The Basic Practice of Statistics
Statistics
ISBN:
9781319042578
Author:
David S. Moore, William I. Notz, Michael A. Fligner
Publisher:
W. H. Freeman

Introduction to the Practice of Statistics
Statistics
ISBN:
9781319013387
Author:
David S. Moore, George P. McCabe, Bruce A. Craig
Publisher:
W. H. Freeman