You are given data to analyze for a new chemotherapeutic to eliminate malignant tumors and must determine if a significant relationship of any kind exists for the latest drug that was proposed. This new drug, XA98 has shown promising results across multiple repeated cross-sectional studies and now combined evidence was gathered to see if any relationships stand out among the multiple tests that were conducted in the past. The data for XA98 to combat specific cancer tumors can be found below, establish whether or not any significant relationships exist among the variables and describe how strong these rel


Correlation
Correlation defines a relationship between two independent variables. It tells the degree to which variables move in relation to each other. When two sets of data are related to each other, there is a correlation between them.
Linear Correlation
A correlation is used to determine the relationships between numerical and categorical variables. In other words, it is an indicator of how things are connected to one another. The correlation analysis is the study of how variables are related.
Regression Analysis
Regression analysis is a statistical method in which it estimates the relationship between a dependent variable and one or more independent variable. In simple terms dependent variable is called as outcome variable and independent variable is called as predictors. Regression analysis is one of the methods to find the trends in data. The independent variable used in Regression analysis is named Predictor variable. It offers data of an associated dependent variable regarding a particular outcome.
You are given data to analyze for a new chemotherapeutic to eliminate malignant tumors and must determine if a significant relationship of any kind exists for the latest drug that was proposed. This new drug, XA98 has shown promising results across multiple repeated cross-sectional studies and now combined evidence was gathered to see if any relationships stand out among the multiple tests that were conducted in the past.
The data for XA98 to combat specific cancer tumors can be found below, establish whether or not any significant relationships exist among the variables and describe how strong these relationships are by using linear regression to establish any relationships that can be described with a simple model and pinpoint which variables are critical for understanding these relationships.
The dataset consists of four variables, in vivo fluorescence for XA98 (photon arrival time in picoseconds); tumor size (in volume mm3); ultrasonography for XA98 (in hertz); excitation light for XA98 (in nm)
(DEPENDENT VARIABLE)
tumor_size: 23, 43, 51, 56, 72, 34, 98, 12, 34, 23
(INDEPENDENT VARIABLES)
vivo_fluor: 123, 34, 56, 78, 29, 19, 101, 283, 98, 76
ultrasono: 34, 44, 54, 44, 34, 44, 45, 54, 67, 88
excitation: 110, 112, 114, 112, 113, 114, 224, 112, 115, 111
Establish whether or not there is any significant relationships exist among variables:
Correlation:
Correlation analysis is used to measure the strength of the association between variables. In other words, it can be said that correlation describes the linear associations between quantitative variables.
Here, the response variable is Tumor_size.
The predictors variables are Vivo_flour, Ultrasono, Excitation.
To describe the relationship among multiple tests that were conducted in the past, correlation is useful.
EXCEL software can be used to obtain the correlation matrix.
Software Procedure:
Step-by-step software procedure to obtain correlation matrix using EXCEL software is as follows:
- Open an EXCEL file.
- Enter the data of the variable Tumor_size in columns A and name it as Tumor_size.
- Enter the data of the variables Vivo_flour, Ultrasono, Excitation in columns B, C, D and name them as Vivo_flour, Ultrasono, Excitation.
- Go to Data > Data Analysis > Correlation.
- In Input Range enter $A$1:$D$11.
- Select Labels.
- Click OK.
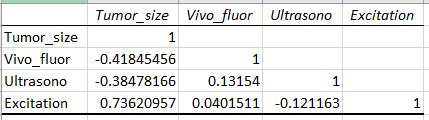
The output is:
Since, the level of significance is not known, the prior level of significance α = 0.05 can be used.
From the Table of Critical Values of Pearson correlation, the critical value corresponding to 0.05 level of significance and d.f = 8 are -0.632 and +0.632.
Decision rule based on P-value approach:
If r < negative critical value or r > positive critical value, then the correlation is significant.
Otherwise, the correlation is not significant.
Significance of Vivo_fluor:
The correlation between Tumor_size and Vivo_fluor is -0.4185.
Here, -0.4185 is not less than -0.632.
Hence, there is no significant relationship between Tumor_size and Vivo_fluor.
Significance of Ultrasono:
The correlation between Tumor_size and Ultrasono is -0.3848.
Here, -0.3848 is not less than -0.632.
Hence, there is no significant relationship between Tumor_size and Ultrasono.
Significance of Excitation:
The correlation between Tumor_size and Ultrasono is 0.7362.
Here, 0.7362 is greater than 0.632.
Hence, there is significant relationship between Tumor_size and Excitation.

Trending now
This is a popular solution!

Step by step
Solved in 2 steps with 3 images


