You are given the following frequency distribution. Class Frequency 10 – 19 12 - 20 – 29 19 30 – 39 24 40 – 49 35 - Then, a graph of the cumulative distribution of the above data is called Select one: a. a dot plot O b. a bar graph O c. a pie chart d. an ogive
You are given the following frequency distribution. Class Frequency 10 – 19 12 - 20 – 29 19 30 – 39 24 40 – 49 35 - Then, a graph of the cumulative distribution of the above data is called Select one: a. a dot plot O b. a bar graph O c. a pie chart d. an ogive

Glencoe Algebra 1, Student Edition, 9780079039897, 0079039898, 2018
18th Edition
ISBN:9780079039897
Author:Carter
Publisher:Carter
Chapter10: Statistics
Section10.6: Summarizing Categorical Data
Problem 4CGP

Related questions
Question
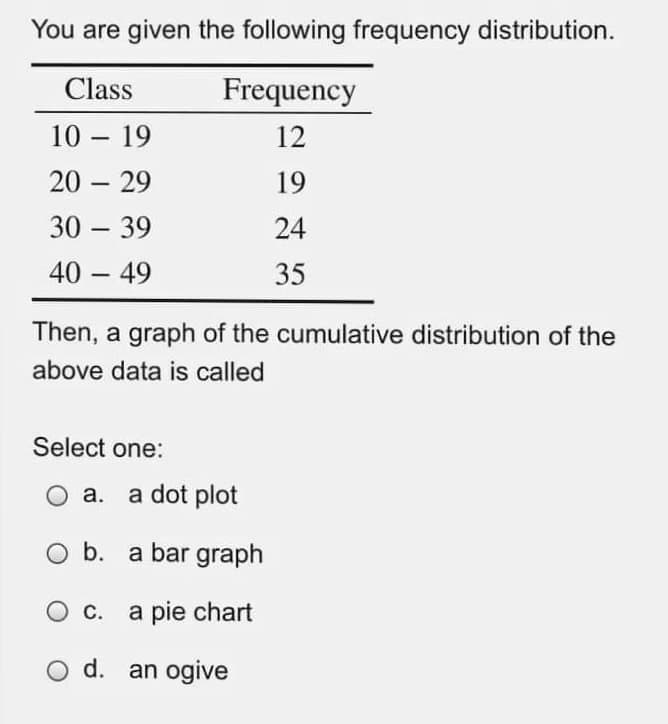
Transcribed Image Text:You are given the following frequency distribution.
Class
Frequency
10 – 19
12
-
20 – 29
19
30 – 39
24
40 – 49
35
-
Then, a graph of the cumulative distribution of the
above data is called
Select one:
a. a dot plot
O b. a bar graph
О с. а pie chart
d. an ogive
Expert Solution
This question has been solved!
Explore an expertly crafted, step-by-step solution for a thorough understanding of key concepts.

Step by step
Solved in 2 steps

Recommended textbooks for you
Glencoe Algebra 1, Student Edition, 9780079039897…
Algebra
ISBN:
9780079039897
Author:
Carter
Publisher:
McGraw Hill
Glencoe Algebra 1, Student Edition, 9780079039897…
Algebra
ISBN:
9780079039897
Author:
Carter
Publisher:
McGraw Hill