You can use your regression analysis results to make which of the following conclusions? (Select all that apply) The financial loss incurred to organizations is significantly higher for V authentication credentials than financial data V identity than financial data A financial than personal data O health than financial data V intellectual property than identity data O identity than health data
You can use your regression analysis results to make which of the following conclusions? (Select all that apply) The financial loss incurred to organizations is significantly higher for V authentication credentials than financial data V identity than financial data A financial than personal data O health than financial data V intellectual property than identity data O identity than health data

Algebra & Trigonometry with Analytic Geometry
13th Edition
ISBN:9781133382119
Author:Swokowski
Publisher:Swokowski
Chapter5: Inverse, Exponential, And Logarithmic Functions
Section5.5: Properties Of Logarithms
Problem 64E

Related questions
Question
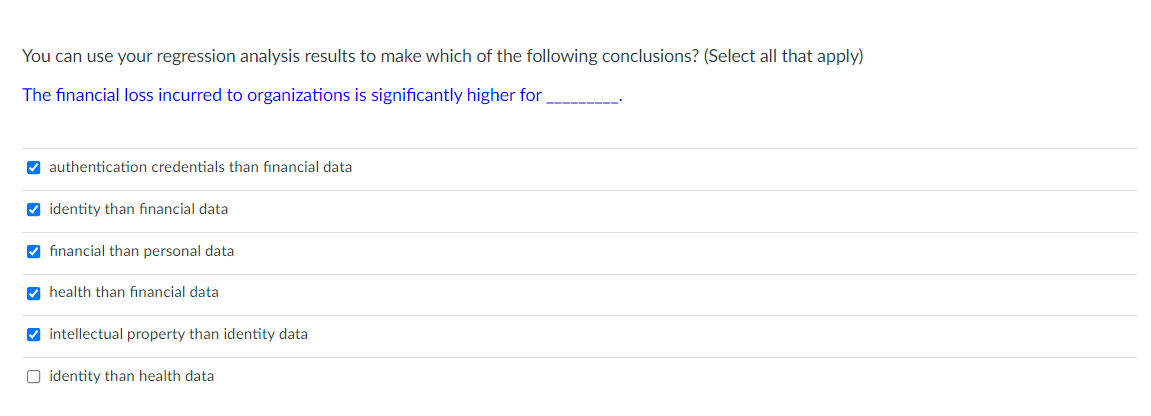
Transcribed Image Text:You can use your regression analysis results to make which of the following conclusions? (Select all that apply)
The financial loss incurred to organizations is significantly higher for
M authentication credentials than financial data
V identity than fınancial data
V financial than personal data
V health than fınancial data
V intellectual property than identity data
O identity than health data
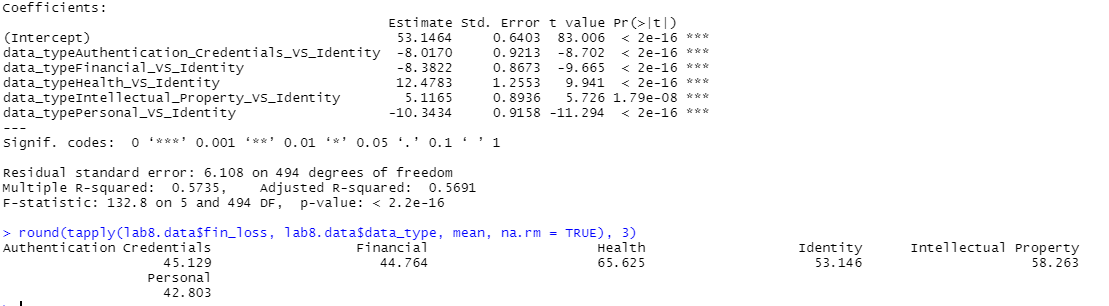
Transcribed Image Text:Coefficients:
Estimate std. Error t value Pr (>|t|)
0. 6403 83.006
0. 9213
0. 8673
(Intercept)
data_typeAuthentication_Credentials_Vs_Identity -8. 0170
data_typeFinancial_vs_Identity
data_typeHealth_vs_Identity
data_typeIntellectual_Property_vs_Identity
data_typePersonal_vs_Identity
< 2e-16 e se se
< 2e-16 e se se
< 2e-16 * se se
< 2e-16
5.726 1.79e-08 ** *
< 2e-16 *e se *
53.1464
-8.702
-9. 665
9. 941
-8. 3822
12.4783
1.2553
0. 8936
0. 9158 -11.294
5. 1165
-10. 3434
signif. codes:
O * ***' 0.001 ***' 0.01 *' 0.05 .' 0.1 '1
Residual standard error: 6.108 on 494 degrees of freedom
Multiple R-squar ed: 0. 5735,
F-statistic: 132. 8 on 5 and 494 DF, p-value: < 2.2e-16
Adjusted R-squared: 0. 5691
> round(tapply(lab8. datasfin_loss, lab8. datasdata_type, mean, na.rm = TRUE), 3)
Нealth
65. 625
Authentication Credentials
Financial
Intellectual Property
58.263
Identity
44.764
45.129
Personal
53.146
42.803
Expert Solution
This question has been solved!
Explore an expertly crafted, step-by-step solution for a thorough understanding of key concepts.

This is a popular solution!

Trending now
This is a popular solution!

Step by step
Solved in 2 steps

Recommended textbooks for you
Algebra & Trigonometry with Analytic Geometry
Algebra
ISBN:
9781133382119
Author:
Swokowski
Publisher:
Cengage
Algebra & Trigonometry with Analytic Geometry
Algebra
ISBN:
9781133382119
Author:
Swokowski
Publisher:
Cengage