Your investment executive claims that the average yearly rate of return on the stocks she recommends is at most OMR 11000. You plan on taking a sample to test her claim. The correct set of hypotheses is O A. Ho: H > 11000 H3:µ<11000 O B. Ho: µ> 11000 H3: H S 11000 O C. Ho: H < 11000 H3: µ 11000 O D. Ho: H < 11000 H:H> 11000
Your investment executive claims that the average yearly rate of return on the stocks she recommends is at most OMR 11000. You plan on taking a sample to test her claim. The correct set of hypotheses is O A. Ho: H > 11000 H3:µ<11000 O B. Ho: µ> 11000 H3: H S 11000 O C. Ho: H < 11000 H3: µ 11000 O D. Ho: H < 11000 H:H> 11000

Algebra & Trigonometry with Analytic Geometry
13th Edition
ISBN:9781133382119
Author:Swokowski
Publisher:Swokowski
Chapter5: Inverse, Exponential, And Logarithmic Functions
Section5.2: Exponential Functions
Problem 55E

Related questions

Topic Video
Question
Transcribed Image Text:Time left 1:32:52
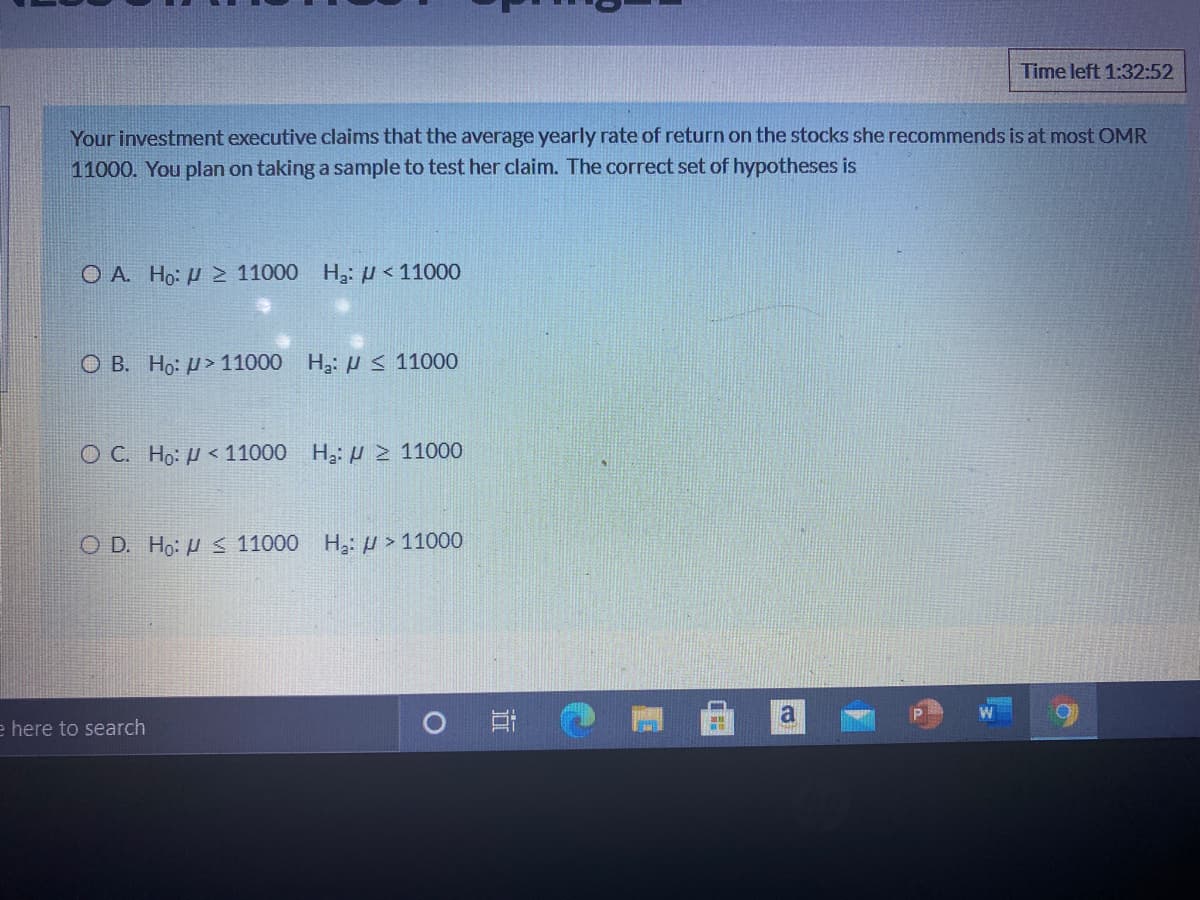
Your investment executive claims that the average yearly rate of return on the stocks she recommends is at most OMR
11000. You plan on taking a sample to test her claim. The correct set of hypotheses is
O A. Ho: H > 11000 H3:u<11000
O B. Ho: H> 11000 H:U< 11000
О С. Но: 11000
H2: µ > 11000
O D. Ho: H < 11000 H,:µ > 11000
a
e here to search
Transcribed Image Text:ESS STATISTICST-Spring21
Time left 1:32:37
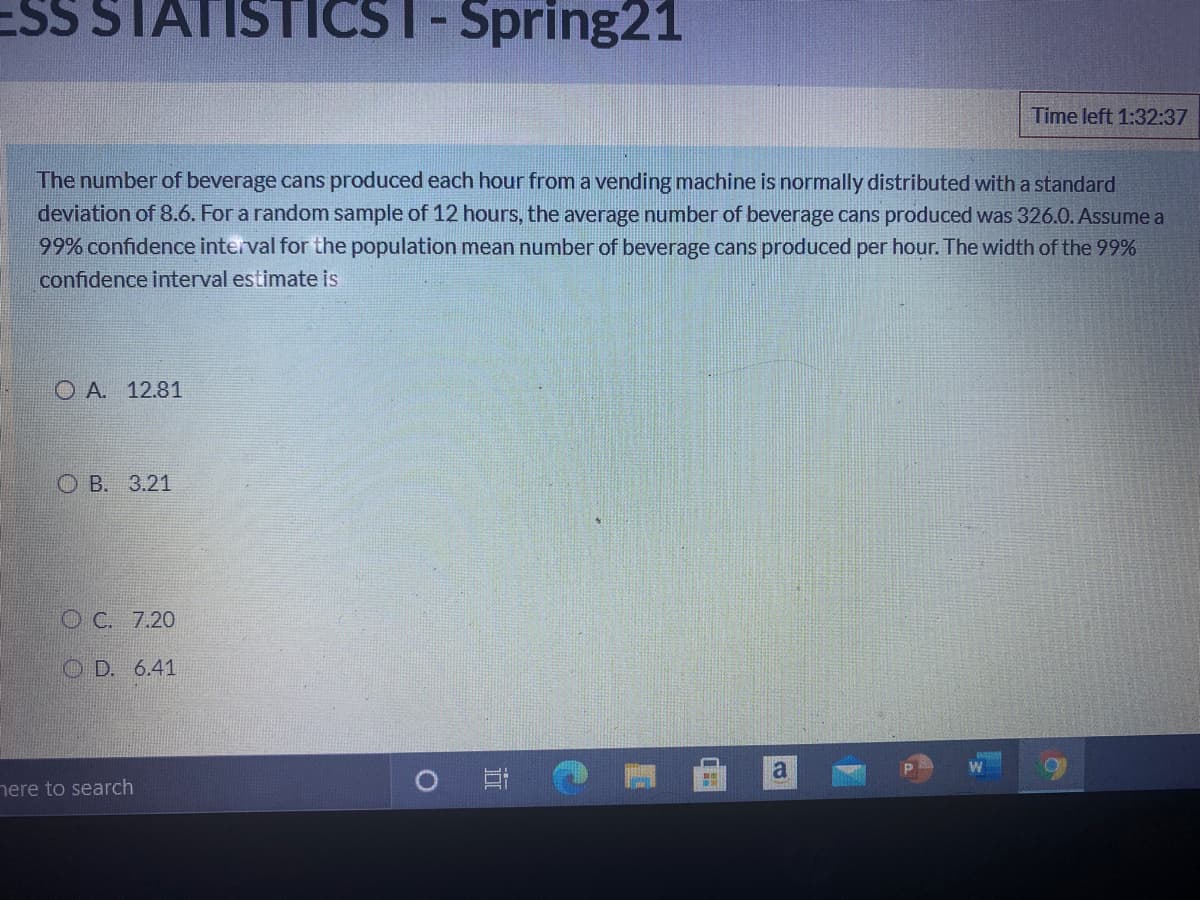
The number of beverage cans produced each hour from a vending machine is normally distributed with a standard
deviation of 8.6. For a random sample of 12 hours, the average number of beverage cans produced was 326.0. Assume a
99% confidence interval for the population mean number of beverage cans produced per hour. The width of the 99%
confidence interval estimate is
O A. 12.81
O B. 3.21
O C. 7.20
O D. 6.41
a
nere to search
Expert Solution
This question has been solved!
Explore an expertly crafted, step-by-step solution for a thorough understanding of key concepts.

This is a popular solution!

Trending now
This is a popular solution!

Step by step
Solved in 4 steps

Knowledge Booster


Learn more about
Need a deep-dive on the concept behind this application? Look no further. Learn more about this topic, statistics and related others by exploring similar questions and additional content below.Recommended textbooks for you
Algebra & Trigonometry with Analytic Geometry
Algebra
ISBN:
9781133382119
Author:
Swokowski
Publisher:
Cengage

Glencoe Algebra 1, Student Edition, 9780079039897…
Algebra
ISBN:
9780079039897
Author:
Carter
Publisher:
McGraw Hill

Trigonometry (MindTap Course List)
Trigonometry
ISBN:
9781337278461
Author:
Ron Larson
Publisher:
Cengage Learning
Algebra & Trigonometry with Analytic Geometry
Algebra
ISBN:
9781133382119
Author:
Swokowski
Publisher:
Cengage
Glencoe Algebra 1, Student Edition, 9780079039897…
Algebra
ISBN:
9780079039897
Author:
Carter
Publisher:
McGraw Hill
Trigonometry (MindTap Course List)
Trigonometry
ISBN:
9781337278461
Author:
Ron Larson
Publisher:
Cengage Learning

Functions and Change: A Modeling Approach to Coll…
Algebra
ISBN:
9781337111348
Author:
Bruce Crauder, Benny Evans, Alan Noell
Publisher:
Cengage Learning