Your manager is trying to determine what forecasting method to use. Based on the following historical data, calculate the following forecasts and specify what procedure you would utilize. Month Actual Demand 1 64 2 67 3 69 4 65 5 71 6 73 7 76 8 77 9 77 10 82 11 83 12 85 Calculate the simple three-month moving average forecast for periods 4–12.(Round your answers to 3 decimal places.) Month Actual Demand 4 66.667 5 67.000 6 68.333 7 69.666 8 73.333 9 75.333 10 76.666 11 78.666 12 80.666 Calculate the weighted three-month moving average for periods 4–12 using weights of 0.30 (for the period t−1); 0.20 (for the period t−2), and 0.50 (for the period t−3). (Do not round intermediate calculations. Round your answers to 1 decimal place.) Month Actual Demand 4 66.7 5 67.0 6 68.3 7 69.7 8 73.3 9 75.3 10 76.7 11 78.7 12 80.7
Your manager is trying to determine what forecasting method to use. Based on the following historical data, calculate the following forecasts and specify what procedure you would utilize. Month Actual Demand 1 64 2 67 3 69 4 65 5 71 6 73 7 76 8 77 9 77 10 82 11 83 12 85 Calculate the simple three-month moving average forecast for periods 4–12.(Round your answers to 3 decimal places.) Month Actual Demand 4 66.667 5 67.000 6 68.333 7 69.666 8 73.333 9 75.333 10 76.666 11 78.666 12 80.666 Calculate the weighted three-month moving average for periods 4–12 using weights of 0.30 (for the period t−1); 0.20 (for the period t−2), and 0.50 (for the period t−3). (Do not round intermediate calculations. Round your answers to 1 decimal place.) Month Actual Demand 4 66.7 5 67.0 6 68.3 7 69.7 8 73.3 9 75.3 10 76.7 11 78.7 12 80.7

Practical Management Science
6th Edition
ISBN:9781337406659
Author:WINSTON, Wayne L.
Publisher:WINSTON, Wayne L.
Chapter13: Regression And Forecasting Models
Section: Chapter Questions
Problem 42P: The file P13_42.xlsx contains monthly data on consumer revolving credit (in millions of dollars)...

Related questions
Question
100%
Your manager is trying to determine what
|
Month |
Actual Demand |
|
1 |
64 |
|
2 |
67 |
|
3 |
69 |
|
4 |
65 |
|
5 |
71 |
|
6 |
73 |
|
7 |
76 |
|
8 |
77 |
|
9 |
77 |
|
10 |
82 |
|
11 |
83 |
|
12 |
85 |
- Calculate the simple three-month moving average forecast for periods 4–12.(Round your answers to 3 decimal places.)
|
Month |
Actual Demand |
|
4 |
66.667 |
|
5 |
67.000 |
|
6 |
68.333 |
|
7 |
69.666 |
|
8 |
73.333 |
|
9 |
75.333 |
|
10 |
76.666 |
|
11 |
78.666 |
|
12 |
80.666 |
- Calculate the weighted three-month moving average for periods 4–12 using weights of 0.30 (for the period t−1); 0.20 (for the period t−2), and 0.50 (for the period t−3). (Do not round intermediate calculations. Round your answers to 1 decimal place.)
|
Month |
Actual Demand |
|
4 |
66.7 |
|
5 |
67.0 |
|
6 |
68.3 |
|
7 |
69.7 |
|
8 |
73.3 |
|
9 |
75.3 |
|
10 |
76.7 |
|
11 |
78.7 |
|
12 |
80.7 |
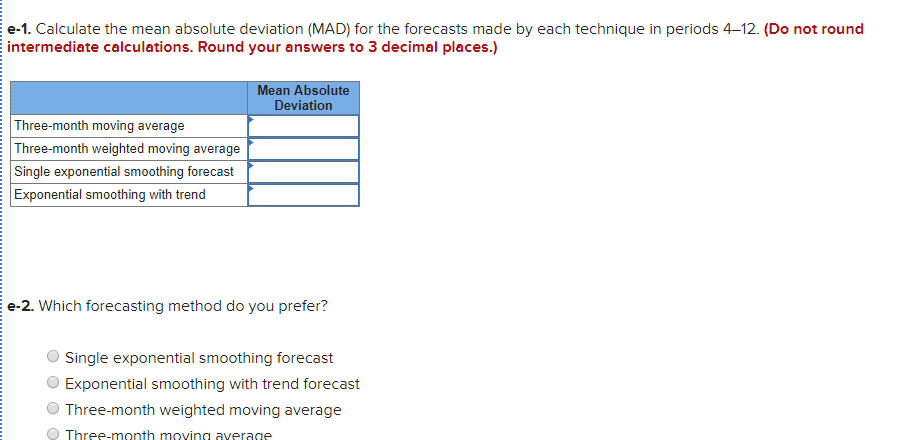
Transcribed Image Text:e-1. Calculate the mean absolute deviation (MAD) for the forecasts made by each technique in periods 4–12. (Do not round
intermediate calculations. Round your answers to 3 decimal places.)
Mean Absolute
Deviation
Three-month moving average
Three-month weighted moving average
Single exponential smoothing forecast
Exponential smoothing with trend
e-2. Which forecasting method do you prefer?
Single exponential smoothing forecast
Exponential smoothing with trend forecast
Three-month weighted moving average
Three-month mnving ayerage
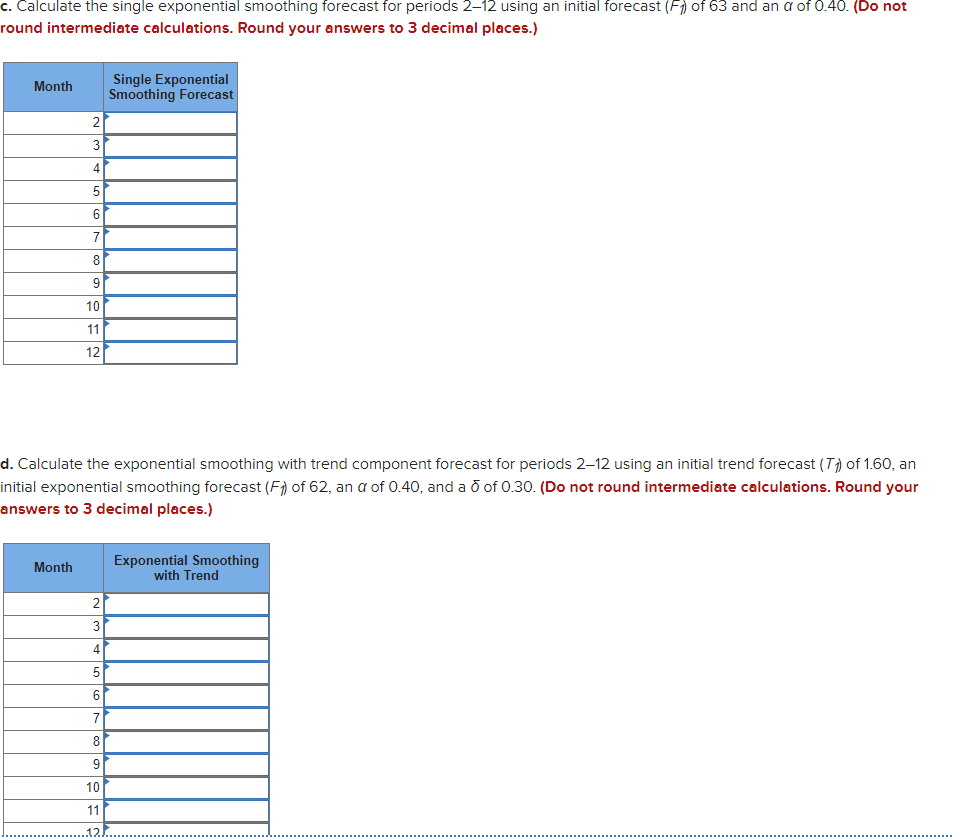
Transcribed Image Text:c. Calculate the single exponential smoothing forecast for periods 2–12 using an initial forecast (F) of 63 and an a of 0.40. (Do not
round intermediate calculations. Round your answers to 3 decimal places.)
Single Exponential
Smoothing Forecast
Month
2
3
4
5
7
8
10
11
12
d. Calculate the exponential smoothing with trend component forecast for periods 2–12 using an initial trend forecast (T) of 1.60, an
initial exponential smoothing forecast (F) of 62, an a of 0.40, and a o of 0.30. (Do not round intermediate calculations. Round your
answers to 3 decimal places.)
Exponential Smoothing
with Trend
Month
2
4
6.
7
8
9
10
11
12.
9,
LO
Expert Solution
This question has been solved!
Explore an expertly crafted, step-by-step solution for a thorough understanding of key concepts.

This is a popular solution!

Trending now
This is a popular solution!

Step by step
Solved in 3 steps with 1 images

Knowledge Booster


Learn more about
Need a deep-dive on the concept behind this application? Look no further. Learn more about this topic, operations-management and related others by exploring similar questions and additional content below.Recommended textbooks for you
Practical Management Science
Operations Management
ISBN:
9781337406659
Author:
WINSTON, Wayne L.
Publisher:
Cengage,

Purchasing and Supply Chain Management
Operations Management
ISBN:
9781285869681
Author:
Robert M. Monczka, Robert B. Handfield, Larry C. Giunipero, James L. Patterson
Publisher:
Cengage Learning

Contemporary Marketing
Marketing
ISBN:
9780357033777
Author:
Louis E. Boone, David L. Kurtz
Publisher:
Cengage Learning
Practical Management Science
Operations Management
ISBN:
9781337406659
Author:
WINSTON, Wayne L.
Publisher:
Cengage,
Purchasing and Supply Chain Management
Operations Management
ISBN:
9781285869681
Author:
Robert M. Monczka, Robert B. Handfield, Larry C. Giunipero, James L. Patterson
Publisher:
Cengage Learning
Contemporary Marketing
Marketing
ISBN:
9780357033777
Author:
Louis E. Boone, David L. Kurtz
Publisher:
Cengage Learning

Marketing
Marketing
ISBN:
9780357033791
Author:
Pride, William M
Publisher:
South Western Educational Publishing