zy Section 3.1 - MAT 240: Applied S x O Upload Documents for Free Acce x G The scatter plot shows the relatic x A New tab x | + -> ô https://learn.zybooks.com/zybook/SNHUMAT240Master1/chapter/3/section/1?content_resource_id=52310089 Not syncing O ... = zyBooks My library > MAT 240: Applied Statistics home > 3.1: Interpreting fitted models E zyBooks catalog ? Help/FAQ e Chemere Rush Jump to level 1 The scatter plot shows the relationship between the population of the city and the number of large wildlife sightings within city limits. 2 200 3 4 150 .. 5 100 50 25000 50000 75000 City population The slope of the line is Ex: 0.2 The intercept of the line is The regression equation is Ý + X. 2 5 P Type here to search O Ei 3:37 AM 4) 9/15/2021 71°F Cloudy ^ Large wildlife sightings
zy Section 3.1 - MAT 240: Applied S x O Upload Documents for Free Acce x G The scatter plot shows the relatic x A New tab x | + -> ô https://learn.zybooks.com/zybook/SNHUMAT240Master1/chapter/3/section/1?content_resource_id=52310089 Not syncing O ... = zyBooks My library > MAT 240: Applied Statistics home > 3.1: Interpreting fitted models E zyBooks catalog ? Help/FAQ e Chemere Rush Jump to level 1 The scatter plot shows the relationship between the population of the city and the number of large wildlife sightings within city limits. 2 200 3 4 150 .. 5 100 50 25000 50000 75000 City population The slope of the line is Ex: 0.2 The intercept of the line is The regression equation is Ý + X. 2 5 P Type here to search O Ei 3:37 AM 4) 9/15/2021 71°F Cloudy ^ Large wildlife sightings

Algebra & Trigonometry with Analytic Geometry
13th Edition
ISBN:9781133382119
Author:Swokowski
Publisher:Swokowski
Chapter3: Functions And Graphs
Section3.2: Graphs Of Equations
Problem 22E

Related questions
Question
Transcribed Image Text:zy Section 3.1 - MAT 240: Applied S x
Upload Documents for Free Acce x G The scatter plot shows the relatic x
A New tab
->
8 https://learn.zybooks.com/zybook/SNHUMAT240Master1/chapter/3/section/1?content_resource_id=52310089
Not syncing
= zyBooks My library > MAT 240: Applied Statistics home > 3.1: Interpreting fitted models
E zyBooks catalog
2 Help/FAQ e Chemere Rush
Jump to level 1
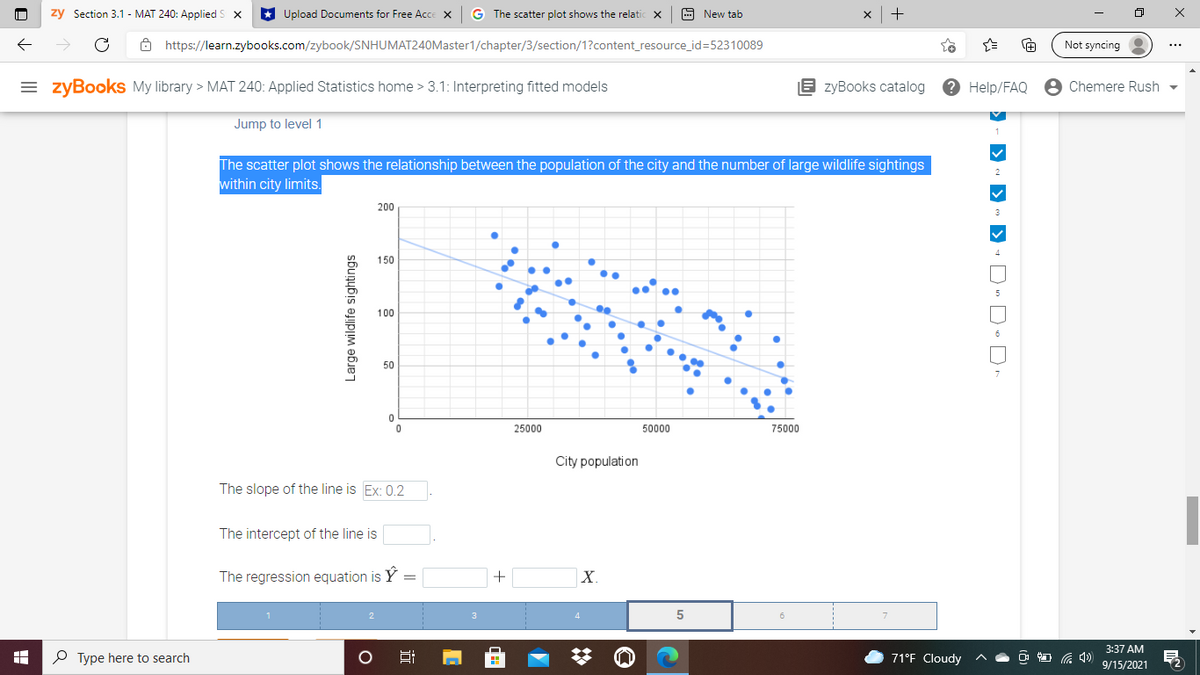
The scatter plot shows the relationship between the population of the city and the number of large wildlife sightings
within city limits.
2
200
3
4
150
5
100
6
50
25000
50000
75000
City population
The slope of the line is Ex: 0.2
The intercept of the line is
The regression equation is Y
X.
3:37 AM
P Type here to search
71°F Cloudy
9/15/2021
Large wildlife sightings
> - )
Expert Solution
This question has been solved!
Explore an expertly crafted, step-by-step solution for a thorough understanding of key concepts.

This is a popular solution!

Trending now
This is a popular solution!

Step by step
Solved in 2 steps with 1 images

Recommended textbooks for you
Algebra & Trigonometry with Analytic Geometry
Algebra
ISBN:
9781133382119
Author:
Swokowski
Publisher:
Cengage
Algebra & Trigonometry with Analytic Geometry
Algebra
ISBN:
9781133382119
Author:
Swokowski
Publisher:
Cengage