
Essentials of Modern Business Statistics with Microsoft Office Excel (Book Only)
7th Edition
ISBN: 9781337298353
Author: David R. Anderson, Dennis J. Sweeney, Thomas A. Williams
Publisher: South-Western College Pub
expand_more
expand_more
format_list_bulleted
Videos
Textbook Question
Chapter 1, Problem 14SE
The following data show the number of rental cars in service for three rental car companies: Hertz, Avis, and Dollar, over a four-year period.
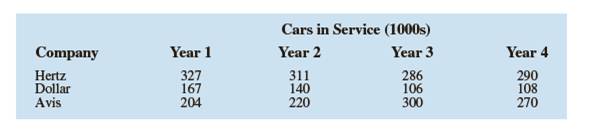
a. Construct a time series graph for the years 1 to 4 showing the number of rental cars in service for each company. Show the time series for all three companies on the same graph.
b. Comment on who appears to be the market share leader and how the market shares are changing over time.
c. Construct a bar chart showing rental cars in service for Year 4. Is this chart based on cross-sectional or time series data?
Expert Solution & Answer
Want to see the full answer?
Check out a sample textbook solution
Students have asked these similar questions
The following data show the number of rental cars in service for three rental car corporations: Henz, Avis and Dollar. The data are for the years 2007-2010 and are in thousands of vehicles (auto Rental News website, May 15, 2011)
Company
2007
2008
2009
2010
Hentz
327
311
286
290
Dollar
167
140
106
108
Avis
204
220
300
270
Construct a time series graph for years 2007 and 2010 showing the number of rental cars service for each company. Show the time series for all three companies on the same graph
Comment on who appears to be the market share leaders and how market shares are changing over time.
Construct a bar chart showing rental cars in service for 2010. Is this chart based on cross sectional or time series data?
The following is a time series for the last 6 months of 2016
50 54 65 58 70 68
The three (3) months moving totals are:
the values of alabama building contracts (in $ millions) for a 12-month period follow.240 350 230 260 280 320 220 310 240 310 240 230a. construct a time series plot. What type of pattern exists in the data?
Chapter 1 Solutions
Essentials of Modern Business Statistics with Microsoft Office Excel (Book Only)
Ch. 1 - Discuss the differences between statistics as...Ch. 1 - Tablet PC Comparison provides a wide variety of...Ch. 1 - Refer to Table 1. 6. a. What is the average cost...Ch. 1 - Table 1. 7 shows data for eight cordless...Ch. 1 - Refer to the data set in Table 1. 7. a. What is...Ch. 1 - J D. Power and Associates surveys new automobile...Ch. 1 - The Kroger Company is one of the largest grocery...Ch. 1 - The Tennessean, an online newspaper located in...Ch. 1 - The Commerce Department reported receiving the...Ch. 1 - The Bureau of Transportation Statistics Omnibus...
Ch. 1 - In a Gallup telephone survey conducted on April...Ch. 1 - The Hawaii Visitors Bureau collects data on...Ch. 1 - Figure 1. 10 provides a bar chart showing the...Ch. 1 - The following data show the number of rental cars...Ch. 1 - The U. S. Census Bureau tracks sales per month for...Ch. 1 - The Energy Information Administration of the U. S....Ch. 1 - A manager of a large corporation recommends a...Ch. 1 - A random telephone survey of 1021 adults (aged 18...Ch. 1 - A Bloomberg Businessweek North American subscriber...Ch. 1 - A survey of 131 investment managers in Barron 's...Ch. 1 - A seven-year medical research study reported that...Ch. 1 - A survey conducted by Better Homes and Gardens...Ch. 1 - Pew Research Center is a nonpartisan polling...Ch. 1 - A sample of midterm grades for five students...Ch. 1 - Table 1. 8 shows a data set containing information...
Knowledge Booster


Learn more about
Need a deep-dive on the concept behind this application? Look no further. Learn more about this topic, statistics and related others by exploring similar questions and additional content below.Similar questions
- The following table shows the number, in millions, of women employed outside the home in the given year.arrow_forwardFor each successive presidential term from Franklin Pierce (the 14th president, elected in 1853) to George W. H. Bush (41st president), the party affiliation controlling the White House is shown below, where R designates Republican and D designates Democrat. (Reference: The New York Times Almanac.)Historical Note: We start this sequence with the 14th president because earlier presidents belonged to political parties such as the Federalist or Wigg party (not Democratic or Republican). In cases in which a president died in office or resigned, the period during which the vice president finished the term is not counted as a new term. The one exception is the case in which Lincoln (a Republican) was assassinated and the vice president Johnson (a Democrat) finished the term. D D R R D R R R R D R D R R R R D D R R D D D D D R R D D R R D R R R Test the sequence for randomness at the 5% level of significance. Use the following outline. (b) Find the number of runs R, n1, n2,…arrow_forwardThe following table gives the annual salary for the troupearrow_forward
- The Energy Information Administration of the U.S. Department of Energy providedtime series data for the U.S. average price per gallon of conventional regular gasolinebetween January 2007 and February 2014 (Energy Information Administration website,March 2014). Use the Internet to obtain the average price per gallon of conventionalregular gasoline since February 2014.a. Extend the graph of the time series shown in Figure 1.1.b. What interpretations can you make about the average price per gallon of conventionalregular gasoline since February 2014?c. Does the time series continue to show a summer increase in the average price pergallon? Explain.arrow_forwardThe following table shows the number of siblings and daily allowance of 12 students from a Grade 11 class:arrow_forwardCan you identify a time series from the following? The number of "likes" on Gucci Facebook page for a new handbag, as of now Distance travelled by airline passengers for the top 4 airliners in 1965 Quarterly unemployment rate in Namibia, 2015-2020 Gross Domestic Product per capita of Zimbabwe in 2020arrow_forward
- Respond to each of the items using the following time series data. Period Demand 1 104 2 132 3 117 4 120 5 104 6 141 7 120 8 136 9 109 10 143 11 142 12 109 13 113 14 124 15 113 16 107arrow_forwardFor the hawkins company, the monthly percentages of all shipments received on timeover the past 12 months are 80, 82, 84, 83, 83, 84, 85, 84, 82, 83, 84, and 83.a. construct a time series plot. What type of pattern exists in the data?arrow_forwardThe following is a record of Michael Jordan's remarkable basketball career up through 1998 (when he retired for the second time). SEASON AVERAGE POINTS PER GAME 1986-87 37.1 1987-88 35.0 1988-89 32.5 1989-90 33.6 1990-91 31.5 1991-92 30.1 1992-93 30.6…arrow_forward
- The following chart shows "living wage" jobs in Rochester per 1000 working age adults over a 5 year period. Year 1997 1998 1999 2000 2001 Jobs 630 680 715 745 770 What is the average rate of change in the number of living wage jobs from 1997 to 1999?--------- Jobs/YearWhat is the average rate of change in the number of living wage jobs from 1999 to 2001?---------- Jobs/Yeararrow_forwardThe following information looks at computer ownership by year. 1985 8.2 (percentage of households) 1990 15.0 1994 22.8 1995 24.1 1998 36.6 1999 42.1 2000 51.0 Construct a timeline (recognizing that time intervals are not even!) Comment about any trends you might see.arrow_forwardCalculate the starting and ending point for each of the five intervals in Question 4.arrow_forward
arrow_back_ios
SEE MORE QUESTIONS
arrow_forward_ios
Recommended textbooks for you
 MATLAB: An Introduction with ApplicationsStatisticsISBN:9781119256830Author:Amos GilatPublisher:John Wiley & Sons Inc
 Probability and Statistics for Engineering and th...StatisticsISBN:9781305251809Author:Jay L. DevorePublisher:Cengage Learning
 Statistics for The Behavioral Sciences (MindTap C...StatisticsISBN:9781305504912Author:Frederick J Gravetter, Larry B. WallnauPublisher:Cengage Learning
 Elementary Statistics: Picturing the World (7th E...StatisticsISBN:9780134683416Author:Ron Larson, Betsy FarberPublisher:PEARSON
 The Basic Practice of StatisticsStatisticsISBN:9781319042578Author:David S. Moore, William I. Notz, Michael A. FlignerPublisher:W. H. Freeman
 Introduction to the Practice of StatisticsStatisticsISBN:9781319013387Author:David S. Moore, George P. McCabe, Bruce A. CraigPublisher:W. H. Freeman
MATLAB: An Introduction with Applications
Statistics
ISBN:9781119256830
Author:Amos Gilat
Publisher:John Wiley & Sons Inc
Probability and Statistics for Engineering and th...
Statistics
ISBN:9781305251809
Author:Jay L. Devore
Publisher:Cengage Learning
Statistics for The Behavioral Sciences (MindTap C...
Statistics
ISBN:9781305504912
Author:Frederick J Gravetter, Larry B. Wallnau
Publisher:Cengage Learning
Elementary Statistics: Picturing the World (7th E...
Statistics
ISBN:9780134683416
Author:Ron Larson, Betsy Farber
Publisher:PEARSON
The Basic Practice of Statistics
Statistics
ISBN:9781319042578
Author:David S. Moore, William I. Notz, Michael A. Fligner
Publisher:W. H. Freeman
Introduction to the Practice of Statistics
Statistics
ISBN:9781319013387
Author:David S. Moore, George P. McCabe, Bruce A. Craig
Publisher:W. H. Freeman
Time Series Analysis Theory & Uni-variate Forecasting Techniques; Author: Analytics University;https://www.youtube.com/watch?v=_X5q9FYLGxM;License: Standard YouTube License, CC-BY
Operations management 101: Time-series, forecasting introduction; Author: Brandoz Foltz;https://www.youtube.com/watch?v=EaqZP36ool8;License: Standard YouTube License, CC-BY