
Videos
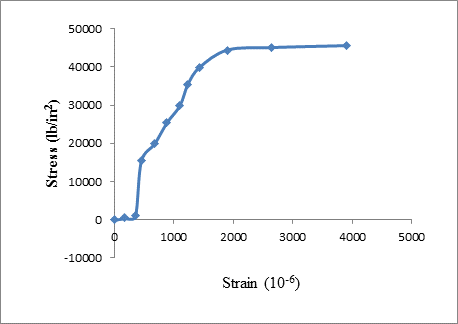
The results of a tensile test are shown in Table 1.5.2. The test was performed on a metal specimen with a circular cross section. The diameter was
a. Use the data in Table 1.5.2 to produce a table of stress and strain values.
b. Plot the stress-strain data and draw a best-fit curve.
c. Compute the, modulus of elasticity from the initial slope of the curve.
d. Estimate the yield stress.

Trending nowThis is a popular solution!

Chapter 1 Solutions
Steel Design (Activate Learning with these NEW titles from Engineering!)
Additional Engineering Textbook Solutions
Materials for Civil and Construction Engineers (4th Edition)
Foundation Design: Principles and Practices (3rd Edition)
Structural Analysis (10th Edition)
Structural Steel Design (6th Edition)
Elementary Surveying: An Introduction To Geomatics (15th Edition)
Elementary Surveying (14th Edition)


- The data in Table 1.5.3 were obtained from a tensile test of a metal specimen with a rectangular cross section of 0.2011in.2 in area and a gage length (the length over which the elongation is measured) of 2.000 inches. The specimen was not loaded to failure. a. Generate a table of stress and strain values. b. Plot these values and draw a best-fit line to obtain a stress-strain curve. c. Determine the modulus of elasticity from the slope of the linear portion of the curve. d. Estimate the value of the proportional limit. e. Use the 0.2 offset method to determine the yield stress.arrow_forwardA tensile test was performed on a metal specimen having a circular cross section with a diameter of 0.510 inch. For each increment of load applied, the strain was directly determined by means of a strain gage attached to the specimen. The results are shown in Table 1.1.a. Prepare a table of stress and strainb. Plot these data to obtain a stress-strain curve. Do not connect the data points; draw a best-fit straight line through them.c. Determine the modulus of elasticity as the slope of the best-fit lineLoad (Ib)Strain × 106 (in./in.)0025037.150070.31000129.11500230.12000259.42500372.43000457.73500586.5arrow_forward1. Given the data, plot the stress-strain diagram 2. Determine the proportional limit 3. Determine the modulus of elasticityarrow_forward
- The tensile test was conducted on a specimen with a diameter of 0.5 inch. A strain gage was bonded to the specimen so that the strain could be obtained directly. The following data were obtained. a) create a table of stress and strain values. Plot this data points and draw the best fit straight line through them. b) what is the slope of this line? What does this value represent?arrow_forwardA tension test is being conducted on a steel-rod specimen with a gauge length of L0=2 in and initial diameter of d0=0.5 in. Data were collected to form the conventional stress-strain diagram as shown. From the diagram, f = 74.0 ksi, e = 104.0 ksi , g = 85.0 ksi , and h = 0.15 in/in. Assuming that the strain remains constant throughout the region between the gauge points, determine the nominal strain ε experienced by the rod if it is elongated to L = 2.7 in . Assuming that the stress is constant over the cross-sectional area and if the tension force used is P = 11.0 kips, find the nominal stress experienced by the rod. Determine the force P needed to reach the ultimate stress in the steel-rod specimen.arrow_forwardA tensile force of 20 kN is applied to a specimen with a gage length of 50mm. It is then noted that the distance between the gage marks became 50.122mm. a,) What is the modulus of elasticity of the specimen if its diameter is 10mm? b.) What is the axial stress of the specimen?Note: Please show detailed solutions with illustrations.arrow_forward
- The data shown in the table were obtained from a tensile test of a metal specimen with a rectangular cross-section of 0.2 in.^2 in area and a gage length (the length over which the elongation is measured) of 2.000 inches.arrow_forwardThe plates in the figure below are each 3 inches by 0.5 inches in cross section. If the hole in each plate is 13/16 in diameter and the load p is 20 kips, determine the average tensile stress in the plate.arrow_forwardA tension test is being conducted on a steel-rod specimen with a gauge length of L0=50mm and initial diameter of d0=13mm. Data were collected to form the conventional stress-strain diagram as shown. From the diagram, f = 510 MPa , e = 693 MPa , g = 565 MPa , and ℎ = 0.15 mm/mm Assuming that the strain remains constant throughout the region between the gauge points, determine the nominal strain ε experienced by the rod if it is elongated to L = 65.0 mm.arrow_forward
- The strain rosette shown in the figure was used to obtain the following normal strain data on a piece of aluminum. The plate has a modulus of elasticity of 10,000 ksi and a Poisson’s Ratio of 0.35. The strain readings were εa = 600 με, εb = 900 με, and εc = 120 με. Note: 1 με = 1 X 10⁻⁶ in/in. a) Calculate the normal strain in the x- and y- directions (εx and εy) and the shear strain (γxy) using a system of equations. b) Calculate the normal stress σx in ksi. Clearly indicate Tension (T) or Compression (C). Note: even though the normal stress in the z-direction is zero, but the normal strain in the z-direction is NOT zero. [Ans. to Check σx = 7.18 ksi (T)] c) Calculate the normal stress σy in ksi. Clearly indicate Tension (T) or Compression (C). d) Calculate the shear stress τxy in ksi.arrow_forwarda. Assuming the computer and the printer are turned on, what will be the next step to do when trying to perform a test?b. What part of the UTM will you use to remove the tensile test specimen from the grips?c. In what direction does the lower crosshead move during a tensile test?d. In what direction does the lower crosshead move during a compression test?e. In what direction does the lower crosshead move during a bending test?arrow_forward50% Due to loading, the plate is deformed into the dashed shape shown in the figure. Assume a = 32 in., b= 40 in., δ1= 0.225 in., δ2= 0.075 in. Determine the average normal strain along the side AB? Determine the average shear strain in the plate at A relative to the horizontal and vertical axes?arrow_forward
 Steel Design (Activate Learning with these NEW ti...Civil EngineeringISBN:9781337094740Author:Segui, William T.Publisher:Cengage Learning