Amarket consists of three stocks whose expected returns are rı, r2, r3 respectively. The risks of the stocks are o1, 02, 03 respectively. The correlation of the returns of Stock 1 with the returns of Stock 2 and Stock 3 are p12 and P.3 respectively The returns of Stock 2 and Stock 3 are independent. Let P be a portfolio of the three stocks with weights (w, W2, W3) respectively. Let op denote the risk of such a portfolio Given the information above, write down the expression for of/2
Q: 2. (a) You have a two-asset portfolio that comprises Stock PY and Stock NY with the following…
A: Portfolio standard deviation is the standard deviation of all the different investments in the…
Q: which of the following stocks are undervalued, overvalued and fairly valued.
A: The return which is expected to be earned by investing in security is known as the Required Rate of…
Q: From the following information, calculate covariance between stocks A and B and expected return and…
A: Correlation between A and B = 0.65 Weight of A in portfolio = 50% Weight of B in portfolio = 50%…
Q: Consider the following stocks with equal probabilities of return: Outcome | Return (Stock A) |…
A: The expected return is the return of the portfolio which is the sum of each potential return that is…
Q: A portfolio consists of three stocks A,B and C with sharpe ratios of 1.5,2 and 2.5 respectively.…
A: Investment: It is the activity of allocation of money in the expectation of some benefit in return…
Q: Let r be the expected return of stock i, rRE represent the risk-free rate, b represent the Beta of a…
A: Capital Asset Pricing Model: The CAPM explains the relationship between expected return and…
Q: Suppose the market risk premium is 9 % and also that the standard deviation of returns on the market…
A: Expected rate of return is the minimum return that a shareholder requires on the investment made in…
Q: b) The covariance between stocks A and B is 0.0014, standard deviation of stock A is 0.032, and…
A: Returns do not rise in the proportion to the level of the risk assumed. Therefore, b the figure is…
Q: The table below is a correlation matrix for Shares A, B and C. Each cell in the table shows the…
A: Investing in negatively correlated stocks indicate that one stock moves in the opposite direction as…
Q: Consider the following table, which gives a security analyst's expected return on two stocks for two…
A: Expected rate of return can be described as the summation of all likely return on the investment…
Q: The table below contains the covariance matrix of stock returns and the market. Assume that the…
A: Risk is the possibility of loss for an organization and risk management is one of the most important…
Q: Assume you wish to evaluate the risk and return behaviors associated with various combinations of…
A: Range refers to the difference between the highest and the lowest values over a specific period of…
Q: Suppose the beta estimated from the CAPM for stock A is 2.3 and stock B is 1.1. What is the beta…
A: CAPM stands for the Capital Asset Pricing Model. It defines the relationship of the systematic risk…
Q: Stock A Return Probability of the Return 18% 25% 14 50 10 25 Stock B Return Probability of the…
A: a. EA = ∑N RN ×PN................(1) Where, N= no of scenario R= return in different scenario P=…
Q: Consider the following table, which gives a security analyst's expected return on two stocks for two…
A: The formula to calculate beta of stock is given below:
Q: An analyst has modeled the stock of a company using a FamaFrench three-factor model and has…
A: Computation of predicted Return and unexplained Return is shown below: Hence, predicted return is…
Q: Assume the market portfolio's and risk-free rate's projected returns are 13% and 3%, respectively.…
A: There are various portfolio performance measures and one such measure is Treynors' ratio. This ratio…
Q: Suppose that the index model for stocks A and B is estimated from excess returns with the following…
A: Covariance is a statistical measure used to analyze the relationship between two variables.…
Q: You have the following data on three stocks: Stock Standard Deviation Beta A. 0.15 0.79 0.25 0.61 C…
A:
Q: Assume that you have a portfolio of two stocks, X and Y. If the risk of stock X is 1.2 and the risk…
A: Given, the risk of stock X is 1.2 and the risk of stock Y is 4
Q: The following information describes the expected return and risk relationship for the stocks of two…
A: a.
Q: CAPM, PORTFOLIO RISK. AND RETURN Consider the following information for Stocks X, Y, and Z. The…
A: Note : As per our guidelines, we can only answer up to 3 subparts only. Please post other parts…
Q: Following is information for two stocks: Investment r σ Stock X 8% 10%…
A: Relative risk can be judged by comparing the coefficient of variation (CV) of both the securities.…
Q: the three stocks are positively correlated, but they are not perfectly correlated. (That each of the…
A: Hello. Since your question has multiple sub-parts, we will solve first three sub-parts for you. If…
Q: The covariance between stocks A and B is 0.0014, standard deviation of stock A is 0.032, and…
A: Covariance: It is a tool that helps in judging the movement of two options. If the covariance…
Q: b) The covariance between stocks A and B is 0.0014, standard deviation of stock A is 0.032, and…
A: Correlation determines how assets move in relation to each other. A coefficient of 1 means a perfect…
Q: Suppose that the average stock has a volatility of 53%, and that the correlation between pairs of…
A: A combined investment that includes different kinds of market securities is term as the portfolio.
Q: Three portfolios are created using shares of Stock A and Stock B. The table below provides the…
A: Portfolio volatility formula: Volatility or standard deviation is represented by σ. w represents…
Q: Using the single index model, what is the alpha of a stock with beta of 1.5, a market return of 14%,…
A: Single index model is used to determine the expected return of a security by considering the…
Q: a) The covariance between stocks A and B is 0.0014, standard deviation of stock A is 0.032, and…
A: “Since you have asked multiple questions, we will solve the first question for you. If you want any…
Q: You have a portfolio of investment which consists of Stock A with a return of A% and Stock B with a…
A: According to the Law of Sum of variances, variances of two stock can be added but that of standard…
Q: Rank the following three stocks by their risk-return relationship, from best to worst: Stock A has…
A: The presentation of the ratio of the standard deviation of the project and the average return of a…
Q: The index model has been estimated for stock A with the following results: RA = 0.01 + 1.2RM + eA.…
A: Standard deviation is referred to as the measure of the dispersion of a dataset relative to its mean…
Q: An individual common stock has a beta of 0.9 and a correlation coefficient of 0.9. The expected…
A:
Q: 1. The following table presents the expected returns of three stocks and the risk free rate. Stock A…
A: Portfolio means a bunch of assets or investments. To reduce the risk, investors invest their funds…
Q: Which stock do you advise Ahmed to select according to the required rate of return? And explain why?
A: Beta is an estimate of risk prevailing in the market. When risk prevailing in the economy is…
Q: Stocks A and B have the following returns: Stock A Stock B 1 0.09 0.06 2 0.05 0.02 0.13 0.05 4 -…
A: A combination of the different types of funds and securities for the investment is term as the…
Q: Suppose you have the following expectations about the market condition and the returns on Stocks X…
A: Given:
Q: The information regarding the risk level of three different stocks is presented below. 1. Which…
A: Higher beta is not desirable.
Q: Suppose the expected returns and standard deviations of Stocks A and B are E(RA) = .092, E(RB) =…
A: The expected rate of return of the portfolio is the weighted average rate of return of all the…
Q: What is the coefficient of variation for stock A?
A: Information Provided: Stock A expected return = 8% Stock A risk = 6%
Q: We have the following information on Stocks A and B. The risk-free rate is S the market risk premium…
A: Stock is overpriced when the expected return is less than required rate and when stock is…
Q: Suppose you are given the following information about 2 stocks, what is the return standard…
A: The degree of data dispersion from the mean is indicated by the standard deviation. Standard…
Q: Suppose that all stocks in an equity market can be grouped into two mutually exclusive portfolios…
A: Sharpe ratio is used by investors to understand the return on an investment compared to its risk.
Q: he covariance between stocks A and B is 0.0014, standard deviation of stock A is 0.032, and standard…
A: We are provided with the graphs, that show the standard deviation (risk) in X-axis and expected…
Q: Stocks A and B have the following probability distributions of expected future returns:…
A: Probability Return Expected return A B C=A*B 0.1 -20% -2.00% 0.2 7% 1.40% 0.4 15% 6.00%…
Q: Assume the risk-free rate is r = 3%. Consider the data in the table below: Stock Expected Return…
A: The capital market line (CML) represents portfolios that optimally combine risk and return. capital…
Q: a. What are the expected returns of the two stocks? b. What are the standard deviations of the…
A: Expected return on a stock can be calculated as the mean of all returns on the stock. That is…
How would i do this question?
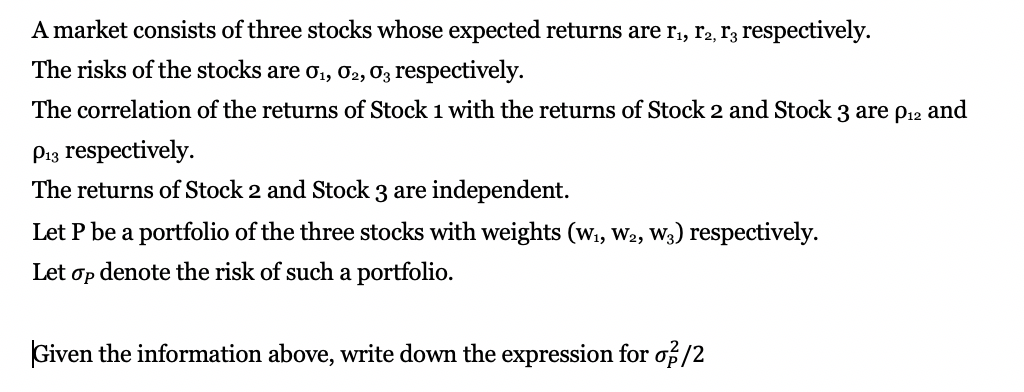
Step by step
Solved in 3 steps with 2 images
- An analyst has modeled the stock of a company using the Fama-French three-factor model. The market return is 10%, the return on the SMB portfolio (rSMB) is 3.2%, and the return on the HML portfolio (rHML) is 4.8%. If ai = 0, bi = 1.2, ci = 20.4, and di = 1.3, what is the stock’s predicted return?The following information describes the expected return and risk relationship for the stocks of two of WAH’s competitors. Stock X 12.0% 20% 1.3 Stock Y 9.0 15 0.7 Market Index 10.0 12 1.0 Risk-free rate 5.0 Using only the data shown in the preceding table: Draw and label a graph showing the security market line, and position Stocks X and Y relative to it. Compute the alphas both for Stock X and for Stock Y. Show your work. Assume that the risk-free rate increases to 7 percent, with the other data in the preceding matrix remaining unchanged. Select the stock providing the higher expected risk adjusted return and justify your selection. Show your calculations.Portfolio P has equal amounts invested in each of the three stocks, A, B, and C. Stock A has a beta of 0.8, Stock B has a beta of 1.0, and Stock C has a beta of 1.2. Each of the stocks has a standard deviation of 25%. The returns on the three stocks are independent of one another (i.e., the correlation coefficients all equal zero). Assume that there is an increase in the market risk premium, but the risk-free rate remains unchanged. Which of the following statements is CORRECT? a. The required return on Stock A will increase by less than the increase in the market risk premium, while the required return on Stock C will increase by more than the increase in the market risk premium. b. The required return on the average stock will remain unchanged, but the returns of riskier stocks (such as Stock C) will increase while the returns of safer stocks (such as Stock A) will decrease. c. The required returns on all three stocks will increase by the amount of the increase in the market…
- Consider the following information for three stocks, A, B, and C. The stocks' returns are positively but not perfectly positively correlated with one another, i.e., the correlations are all between 0 and 1. Expected Standard Stock Return Deviation Beta A 10% 20% 1.0 B 10% 10% 1.0 C 12% 12% 1.4 Portfolio AB has half of its funds invested in Stock A and half in Stock B. Portfolio ABC has one third of its funds invested in each of the three stocks. The risk-free rate is 5%, and the market is in equilibrium, so required returns equal expected returns. Which of the following statements is CORRECT? a. Portfolio AB's coefficient of variation is greater than 2.0. b. Portfolio AB's required return is greater than the required return on Stock A. c. Portfolio ABC's expected return is 10.66667%. d. Portfolio ABC has a standard deviation of 20%. e. Portfolio AB has a standard deviation of 20%.Suppose that the index model for stocks A and B is estimated from excess returns with the following results:RA = 3% + .7RM + eARB = −2% + 1.2RM + eBσM = 20%; R-squareA = .20; R-squareB = .12What are the covariance and the correlation coefficient between the two stocks?The covariance between stocks A and B is 0.0014, the standard deviation of stock A is 0.032, and the standard deviation of stock B is 0.044. Which of the following is the most appropriate to depict the risk-return characteristics of a portfolio consisting of only stocks A and B, and explain why?
- Suppose that the index model for stocks A and B is estimated from excess returns with the following results:RA = 3% + .7RM + eARB = −2% + 1.2RM + eBσM = 20%; R-squareA = .20; R-squareB = .12What is the covariance between each stock and the market index?Suppose that the index model for stocks A and B is estimated from excess returns with the following results:RA = 3% + .7RM + eARB = −2% + 1.2RM + eBσM = 20%; R-squareA = .20; R-squareB = .12What is the standard deviation of each stock?two stocks, A and B, are perfectly correlated. Stock A has an expected return of 0.15 and a volatility of 0.25. stock B has an expected return of 0.20 and a volatility of 0.30. what is the expected return volatility of the portfolio consisting of 45% of stock A and 55% of stock B?
- The index model for stock A has been estimated with the following result: RA = 0.01 + 0.9RM + eA. If σM = 0.25 and R2A = 0.25, the standard deviation of return of stock A is:Stocks A, B, and C have the same expected return and standard deviation. The following table shows the correlation between the returns on these stocks. Stock A Stock B Stock C Stock A +1.0 Stock B +0.9 +1.0 Stock C +0.1 -0.4 +1.0 Given these correlations, the portfolio constructed from these stocks having the lowest risk is a portfolio: Equally invested in stocks A and B. Equally invested in stocks A and C. Equally invested in stocks B and C. Totally invested in stock C.Consider the following information for stocks A, B, and C. The returns on the three stocks are positively correlated, but they are not perfectly correlated. (That is, each of the correlation coefficients is between 0 and 1.) Stock Expected Return Standard Deviation Beta A 9.47% 14% 0.7 B 12.44 14 1.3 C 13.92 14 1.6 Fund P has one-third of its funds invested in each of the three stocks. The risk-free rate is 6%, and the market is in equilibrium. (That is, required returns equal expected returns.) What is the market risk premium (rM - rRF)? Round your answer to two decimal places. % What is the beta of Fund P? Do not round intermediate calculations. Round your answer to two decimal places. What is the required return of Fund P? Do not round intermediate calculations. Round your answer to two decimal places. % Would you expect the standard deviation of Fund P to be less than 14%, equal to 14%, or greater than 14%? Less than 14% Greater than 14%…