
Concept explainers
Videos
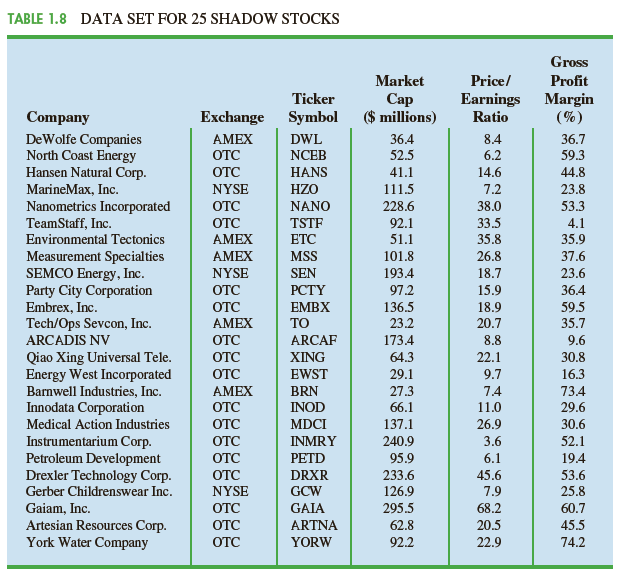
Table 1. 8 shows a data set containing information for 25 of the shadow stocks tracked by the American Association of Individual Investors. Shadow stocks are common stocks of smaller companies that are not closely followed by Wall Street analysts. The data set is also on the website that accompanies the text in the DATA file named Shadow02.
a. How many variables are in the data set?
b. Which of the variables are categorical and which are quantitative?
c. For the Exchange variable, show the frequency and the percent frequency for AMEX, NYSE, and OTC. Construct a bar graph similar to Figure 1. 4 for the Exchange variable. d. Show the frequency distribution for the Gross Profit Margin using the five intervals: 0-14. 9, 15-29. 9, 30-44. 9, 45-59. 9, and 60-74. 9. Construct a histogram similar to Figure 1. 5. e. What is the average price/earnings ratio?

Trending nowThis is a popular solution!

Chapter 1 Solutions
Essentials of Modern Business Statistics with Microsoft Office Excel (Book Only)


 Glencoe Algebra 1, Student Edition, 9780079039897...AlgebraISBN:9780079039897Author:CarterPublisher:McGraw Hill