
Essentials Of Statistics For Business & Economics
9th Edition
ISBN: 9780357045435
Author: David R. Anderson, Dennis J. Sweeney, Thomas A. Williams, Jeffrey D. Camm, James J. Cochran
Publisher: South-Western College Pub
expand_more
expand_more
format_list_bulleted
Concept explainers
Videos
Textbook Question
thumb_up100%
Chapter 1, Problem 5SE
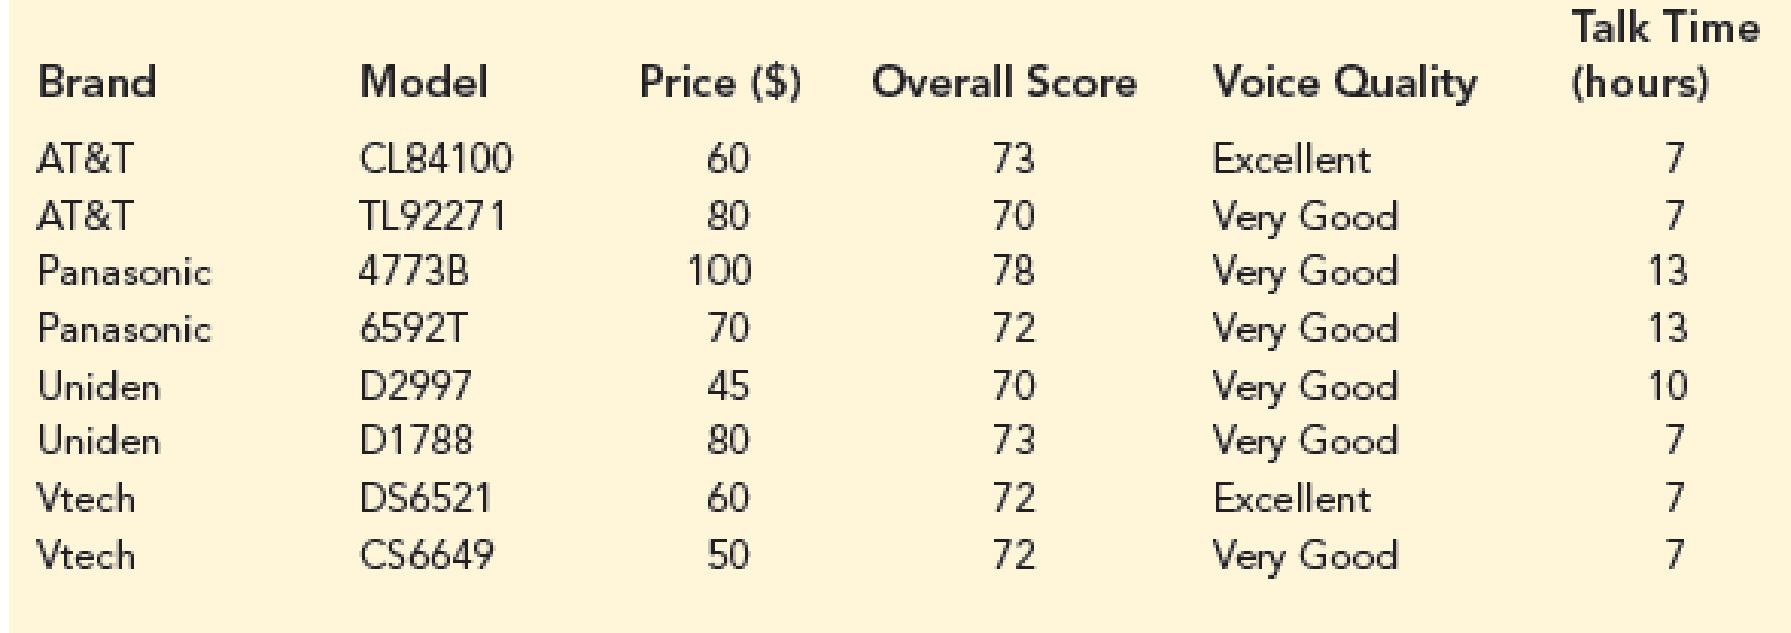
Summarizing Phone Data. Refer to the data set in Table 1.7.
- a. What is the average price for the phones?
- b. What is the average talk time for the phones?
- c. What percentage of the phones have a voice quality of excellent?
TABLE 1.7 Data for Eight Phones
Expert Solution & Answer

Trending nowThis is a popular solution!

Chapter 1 Solutions
Essentials Of Statistics For Business & Economics
Ch. 1 - Discuss the differences between statistics as...Ch. 1 - Tablet PC Comparison provides a wide variety of...Ch. 1 - Refer to Table 1.6.
What is the average cost for...Ch. 1 - Table 1.7 shows data for eight cordless telephones...Ch. 1 - Summarizing Phone Data. Refer to the data set in...Ch. 1 - J.D. Power and Associates surveys new automobile...Ch. 1 - Airline Customer Satisfaction. Many service...Ch. 1 - The Tennessean, an online newspaper located in...Ch. 1 - College-Educated Workers. Based on data from the...Ch. 1 - The Bureau of Transportation Statistics Omnibus...
Ch. 1 - Driverless Cars Expected Soon. A Gallup Poll...Ch. 1 - The Hawaii Visitors Bureau collects data on...Ch. 1 - Facebook Advertising Revenue. Figure 1.8 provides...Ch. 1 - Rental Car Fleet Size. The following data show the...Ch. 1 - Jewelry Sales. The U.S. Census Bureau tracks sales...Ch. 1 - Athletic Shoe Sales. Skechers U.S.A., Inc., is a...Ch. 1 - A manager of a large corporation recommends a...Ch. 1 - A random telephone survey of 1021 adults (aged 18...Ch. 1 - A Bloomberg Businessweek North American subscriber...Ch. 1 - A survey of 131 investment managers in Barron’s...Ch. 1 - A seven-year medical research study reported that...Ch. 1 - A survey conducted by Better Homes and Gardens...Ch. 1 - Teenage Cell Phone Use. Pew Research Center is a...Ch. 1 - A sample of midterm grades for five students...Ch. 1 - Comparing Compact SUVs. Consumer Reports evaluates...
Knowledge Booster


Learn more about
Need a deep-dive on the concept behind this application? Look no further. Learn more about this topic, statistics and related others by exploring similar questions and additional content below.Recommended textbooks for you
 Glencoe Algebra 1, Student Edition, 9780079039897...AlgebraISBN:9780079039897Author:CarterPublisher:McGraw Hill
 Big Ideas Math A Bridge To Success Algebra 1: Stu...AlgebraISBN:9781680331141Author:HOUGHTON MIFFLIN HARCOURTPublisher:Houghton Mifflin Harcourt
 Holt Mcdougal Larson Pre-algebra: Student Edition...AlgebraISBN:9780547587776Author:HOLT MCDOUGALPublisher:HOLT MCDOUGAL
Glencoe Algebra 1, Student Edition, 9780079039897...
Algebra
ISBN:9780079039897
Author:Carter
Publisher:McGraw Hill
Big Ideas Math A Bridge To Success Algebra 1: Stu...
Algebra
ISBN:9781680331141
Author:HOUGHTON MIFFLIN HARCOURT
Publisher:Houghton Mifflin Harcourt
Holt Mcdougal Larson Pre-algebra: Student Edition...
Algebra
ISBN:9780547587776
Author:HOLT MCDOUGAL
Publisher:HOLT MCDOUGAL
Use of ALGEBRA in REAL LIFE; Author: Fast and Easy Maths !;https://www.youtube.com/watch?v=9_PbWFpvkDc;License: Standard YouTube License, CC-BY
Compound Interest Formula Explained, Investment, Monthly & Continuously, Word Problems, Algebra; Author: The Organic Chemistry Tutor;https://www.youtube.com/watch?v=P182Abv3fOk;License: Standard YouTube License, CC-BY
Applications of Algebra (Digit, Age, Work, Clock, Mixture and Rate Problems); Author: EngineerProf PH;https://www.youtube.com/watch?v=Y8aJ_wYCS2g;License: Standard YouTube License, CC-BY