
Concept explainers
Videos
In Exercises 1−4. (a) identify the claim and state H0 and Ha, (b) find the critical value and identify the rejection region, (c) find the chi-square test statistic, (d) decide whether to reject or fail to reject the null hypothesis, and (e) interpret the decision in the context of the original claim.
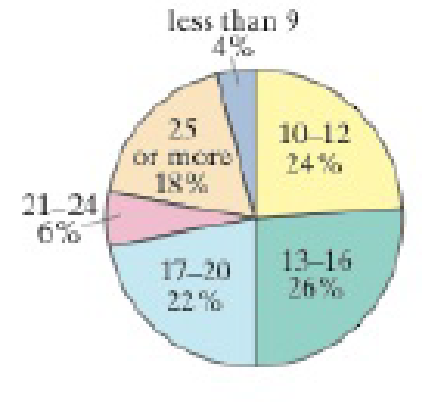
1. A researcher claims that the distribution of the lengths of visits at physician offices is different from the distribution shown in the pie chart. You randomly select 400 people and ask them how long their office visits with a physician were. The table shows the results. At a = 0.01, test the researcher’s claim, (Adapted from Medscape)
| Survey results | |
| Minutes | Frequence, f |
| less than 9 | 20 |
| 10−12 | 80 |
| 13−16 | 113 |
| 17−20 | 91 |
| 21−24 | 40 |
| 25 or more | 56 |
a.
To identify: The claim.
To state: The hypothesis
Answer to Problem 10.1.1RE
The claim is that, the distribution of the lengths differs from the expected distribution.
The hypothesis
Explanation of Solution
Given info:
The data shows the results of the distribution of the lengths of the visits at physician offices.
Calculation:
Here, the distribution of the lengths differs from the expected distribution is tested. Hence, the claim is that the distribution of the lengths differs from the expected distribution.
The hypotheses are given below:
Null hypothesis:
Alternative hypothesis:
b.
To obtain: The critical value.
To identify: The rejection region.
Answer to Problem 10.1.1RE
The critical value is 15.086.
The rejection region is
Explanation of Solution
Given info:
The level of significance is 0.01.
Calculation:
Critical value:
The critical value is calculated by using the
Substitute k as 6 in degrees of freedom.
From the Table 6-Chi-Square Distribution, the critical value for 5 degrees of freedom for
Rejection region:
The null hypothesis would be rejected if
Thus, the rejection region is
c.
To obtain: The chi-square test statistic.
Answer to Problem 10.1.1RE
The chi-square test statistic is 18.770.
Explanation of Solution
Calculation:
Step by step procedure to obtain chi-square test statistic using the MINITAB software:
- Choose Stat > Tables > Chi-Square Goodness-of-Fit Test (One Variable).
- In Observed counts, enter the column of Frequency.
- In Category names, enter the column of Minutes.
- Under Test, select the column of Proportions in Proportions specified by historical counts.
- Click OK.
Output using the MINITAB software is given below:
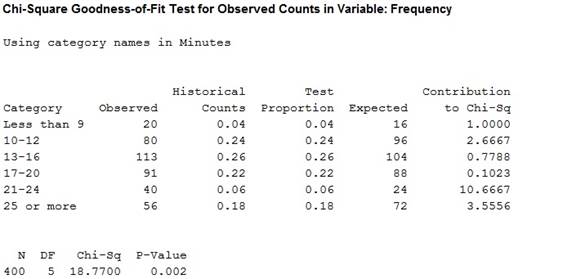
Thus, the chi-square test statistic value is approximately 18.770.
d.
To check: Whether the null hypothesis is rejected or fails to reject.
Answer to Problem 10.1.1RE
The null hypothesis is rejected.
Explanation of Solution
Conclusion:
From the result of (c), the test-statistic value is 18.770.
Here, the chi-square test statistic value is greater than the critical value.
That is,
Thus, it can be conclude that the null hypothesis is rejected.
e.
To interpret: The decision in the context of the original claim.
Answer to Problem 10.1.1RE
The conclusion is that, there is evidence to support the claim that the distribution of the lengths differs from the expected distribution.
Explanation of Solution
Interpretation:
From the results of part (d), it can be conclude that there is evidence to support the claim that the distribution of the lengths differs from the expected distribution.
Want to see more full solutions like this?
Chapter 10 Solutions
Elementary Statistics: Picturing the World (7th Edition)


- Consider a capital market with only two risky assets A and B. Their standard deviations are 1 and 2, respectively. There is no risk-free asset. When the correlation coefficient ρAB = 0, construct a portfolio, whose variance is strictly less than 1. [Hint: you may want to try the portfolio that puts more weight on the security with the lower standard deviation.]arrow_forwardA recent drug survey showed an increase in the use of drugs and alcohol among local high school seniors as compared to the national percentage. Suppose that a survey of 100 local seniors and 100 national seniors is conducted to see if the proportion of drug and alcohol use is higher locally than nationally. Locally, 65 seniors reported using drugs or alcohol within the past month, while 60 national seniors reported using them. Conduct a hypothesis test at the 5% level.NOTE: If you are using a Student's t-distribution for the problem, including for paired data, you may assume that the underlying population is normally distributed. (In general, you must first prove that assumption, though.) Part (a) State the null hypothesis. H0: plocal ≠ pnational H0: plocal > pnational H0: plocal = pnational H0: plocal < pnational Part (b) State the alternative hypothesis. Ha: plocal < pnational Ha: plocal = pnational Ha: plocal ≠ pnational Ha: plocal > pnational…arrow_forwardA recent drug survey showed an increase in the use of drugs and alcohol among local high school seniors as compared to the national percent. Suppose that a survey of 100 local seniors and 100 national seniors is conducted to see if the proportion of drug and alcohol use is higher locally than nationally. Locally, 67 seniors reported using drugs or alcohol within the past month, while 61 national seniors reported using them. Conduct a hypothesis test at the 5% level.NOTE: If you are using a Student's t-distribution for the problem, including for paired data, you may assume that the underlying population is normally distributed. (In general, you must first prove that assumption, though.) State the distribution to use for the test. (Round your answers to four decimal places.) P'local − P'national ~ ,arrow_forward
- A major credit card company is interested in the proportion of individuals who use a competitor’s credit card. Their null hypothesis is H0: p=0.65H0: p=0.65, and based on a sample they find a sample proportion of 0.70 and a pp-value of 0.053. Is there convincing statistical evidence at the 0.05 level of significance that the true proportion of individuals who use the competitor’s card is actually greater than 0.65 ?arrow_forwardHIV/AIDS patients are regularly monitored for their CD4 counts in order to make sure that antiretroviral therapies are effectiveSuppose the distribution of CD4 counts in a population is approximately normal with mu = 237 and sigma = 43 . HIV patients are defined as moving into the AIDS stage of their disease course after their CD4 counts are less than 200. What proportion of patients in this population is suffering from AIDS?arrow_forward3. When you performed null hypothesis tests for two samples using a z-test, what can you conclude about the population growth rate of both samples under consideration if you rejected the null hypothesis?arrow_forward
- A recent drug survey showed an increase in use of drugs and alcohol among local high school seniors as compared to the national percent. Suppose that a survey of 100 local seniors and 100 national seniors is conducted to see if the percentage of drug and alcohol use is higher locally than nationally. Locally, 65 seniors reported using drugs or alcohol within the past month, while 62 national seniors reported using them. Conduct a hypothesis test at the 5% level.NOTE: If you are using a Student's t-distribution for the problem, including for paired data, you may assume that the underlying population is normally distributed. (In general, you must first prove that assumption, though.) What is the test statistic? (Round your answer to two decimal places.)arrow_forwardA recent drug survey showed an increase in use of drugs and alcohol among local high school seniors as compared to the national percent. Suppose that a survey of 100 local seniors and 100 national seniors is conducted to see if the percentage of drug and alcohol use is higher locally than nationally. Locally, 68 seniors reported using drugs or alcohol within the past month, while 63 national seniors reported using them. Conduct a hypothesis test at the 5% level.NOTE: If you are using a Student's t-distribution for the problem, including for paired data, you may assume that the underlying population is normally distributed. (In general, you must first prove that assumption, though.) State the distribution to use for the test. (Round your answers to four decimal places.)arrow_forwardA recent drug survey showed an increase in use of drugs and alcohol among local high school seniors as compared to the national percent. Suppose that a survey of 100 local seniors and 100 national seniors is conducted to see if the percentage of drug and alcohol use is higher locally than nationally. Locally, 68 seniors reported using drugs or alcohol within the past month, while 64 national seniors reported using them. Conduct a hypothesis test at the 5% level.NOTE: If you are using a Student's t-distribution for the problem, including for paired data, you may assume that the underlying population is normally distributed. (In general, you must first prove that assumption, though.) What is the p-value? (Round your answer to four decimal places.)arrow_forward
- I need help finding the Maximum Likelihood estimator of Y1,Y2,...,Yn with a random sample size n from an exponential distribution with parameter β.arrow_forwardSuppose we take a sample of 2,500 blood donors from a population for which 50% (0.5) have type O+ blood. (a) Into what range of possible values should the sample proportion fall 95% of the time, according to the Empirical Rule? to (b) If the sample included only 625 donors instead of 2,500, would the range of possible sample proportions be wider, more narrow, or the same as with a sample of 2,500 donors? Explain your answer, and explain why it makes intuitive sense. The range would be with 625 donors compared to a sample of 2,500 donors since the standard deviation of the sampling distribution would be . This makes intuitive sense because if fewer donors are included in the sample, the proportion will be reliable as an estimate of the proportion.arrow_forwardWhat is the obtained value – does the critical value exceed the obtained value? What does this mean in regards to the null hypothesis?arrow_forward
 MATLAB: An Introduction with ApplicationsStatisticsISBN:9781119256830Author:Amos GilatPublisher:John Wiley & Sons Inc
 Probability and Statistics for Engineering and th...StatisticsISBN:9781305251809Author:Jay L. DevorePublisher:Cengage Learning
 Statistics for The Behavioral Sciences (MindTap C...StatisticsISBN:9781305504912Author:Frederick J Gravetter, Larry B. WallnauPublisher:Cengage Learning
 Elementary Statistics: Picturing the World (7th E...StatisticsISBN:9780134683416Author:Ron Larson, Betsy FarberPublisher:PEARSON
 The Basic Practice of StatisticsStatisticsISBN:9781319042578Author:David S. Moore, William I. Notz, Michael A. FlignerPublisher:W. H. Freeman
 Introduction to the Practice of StatisticsStatisticsISBN:9781319013387Author:David S. Moore, George P. McCabe, Bruce A. CraigPublisher:W. H. Freeman