
Concept explainers
Videos
A random sample of 250 observations was classified according to the row and column categories shown in the table below.

a. Do the data provide sufficient evidence to conclude that the rows and columns are dependent? Test using α = .05.
b. Would the analysis change if the row totals were fixed before the data were collected?
c. Do the assumptions required for the analysis to be valid differ according to whether the row (or column) totals are fixed? Explain.
d. Convert the table entries to percentages by using each column total as a base and calculating each row response as a percentage of the corresponding column total. In addition, calculate the row totals and convert them to percentages of all 250 observations.
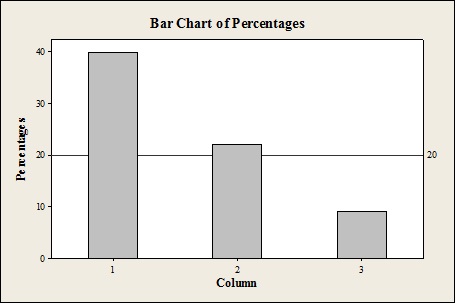
e. Create a bar graph with row 1 percentage on the vertical axis against the column number on the horizontal axis. Draw horizontal lines corresponding to the row 1 percentages. Does the graph support the result of the test conducted in part a?
a.
Answer to Problem 10.40LM
There is enough evidence to conclude that the rows and columns are dependent.
Explanation of Solution
Calculation:
The claim is to test whether the rows and columns are dependent. If the claim is rejected, then there is enough evidence to conclude that the rows and columns are independent.
The null hypothesis for testing the testing the independence of rows and columns are independent is,
Alternative hypothesis:
For checking the relationship between two variables, the chi-square test for independence is used.
The chi-square test statistics is,
The expected values can be obtained as follows:
The test statistic can be obtained as follows:
Thus the value of test statistic is 54.14.
Degrees of freedom:
The degrees of freedom for the test statistic is,.
Thus, the degrees of freedom for the test is 4.
Critical value:
The level of significance is given as
Use Table IV, Appendix D to find the critical values.
Procedure:
- Locate 4 in the column of degrees of freedom in the Table IV.
- Take the value corresponding to
From the table the critical value is
Thus, the rejection region is
Rejection Rule:
If
Conclusion:
The chi square test statistic is 54.14 and the critical value is 9.48773.
The chi square test statistic is greater than the critical value.
That is,
Therefore, the null hypothesis is rejected.
Thus, there is enough evidence to conclude that rows and columns are dependent at
b.
To check: Whether the analysis change if the row totals were fixed before the data were collected.
Answer to Problem 10.40LM
No. If the row totals were fixed before the data were collected then there will be no change in the analysis.
Explanation of Solution
Justification:
Here the row totals were fixed before the data were collected then the analysis remains identical.
c.
To explain: Whether the assumptions required for the analysis to be valid differ according to whether the row ( or column) totals are fixed.
Answer to Problem 10.40LM
Yes, the assumptions required for the analysis to be valid differ according to whether the row (or column) totals are fixed.
Explanation of Solution
If the row and column totals are not fixed then the random samples are taken from a multinomial distribution. If the row totals are fixed then the samples of size k are taken from k multinomial population.
d.
To convert: The table entries to percentages by using each column total as a base and calculating each row response as a percentage of the corresponding column total.
To calculate: The row totals and convert them to percentages of all 250 observations.
Answer to Problem 10.40LM
The percentages in a table is as follows:
| Column | Totals | ||||
| 1 | 2 | 3 | |||
| Rows | 1 |
|
|
|
|
| 2 |
|
|
|
| |
| 3 |
|
|
|
| |
Explanation of Solution
Given info:
A
Justification:
To get the percentage corresponding to each frequency first divide the numbers in each column by the column total and then multiply by 100. Also, divide the row totals by the overall total and then multiply by 100.
Percentage of the (1,1) cell
The percentage of (1,1 )cell can be obtained as follows:
Substitute 20 for “frequency of the cell” and 50 for “ column total” in the above equation.
The required percentage value is,
Thus the percentage corresponding to cell (1,1) is 40%.
Similarly percentage corresponding other cell can be obtained as shown in the following table:
| Column | Totals | ||||
| 1 | 2 | 3 | |||
| Rows | 1 |
|
|
|
|
| 2 |
|
|
|
| |
| 3 |
|
|
|
| |
e.
To create: A bar graph with row 1 percentage on the vertical axis and column number on the horizontal axis.
To show: The row 1 total percentage as a horizontal lie on the graph.
To check: The graph support the result of the test conducted in part a.
Answer to Problem 10.40LM
Output using the MINITAB software is given below:
The graph support the result of the test conducted in part a.
Explanation of Solution
Calculation:
The row 1 total percentage can be obtained as follows:
Bar graph:
Software procedure:
Step by step procedure to obtain the test statistic using the MINITAB software:
- Choose Graph > Bar Chart.
- From Bars represent, choose Values from a table.
- Choose Simple. Click OK.
- In Graph variables, enter the column of Column.
- In Categorical, enter the column of Percentages.
- Click OK.
Interpretation:
The bar chart is constructed by taking the columns of row 1 along horizontal axis and its corresponding percentage along vertical axis. The reference line is marked at 20%.
Conclusion:
If the rows and columns are independent then the row percentage in each column should close to the row total percentages. Here the row percentage in each column is not close to the row total percentages. Thus it implies that the row and column are not independent.
The plot supports the decision in part a.
Want to see more full solutions like this?
Chapter 10 Solutions
Statistics For Business And Economics, University Of Connecticut
Additional Math Textbook Solutions
Intro Stats, Books a la Carte Edition (5th Edition)
An Introduction to Mathematical Statistics and Its Applications (6th Edition)
Statistical Reasoning for Everyday Life (5th Edition)
STATS:DATA+MODELS-W/DVD
Elementary Statistics: Picturing the World (7th Edition)


 Glencoe Algebra 1, Student Edition, 9780079039897...AlgebraISBN:9780079039897Author:CarterPublisher:McGraw Hill
 Holt Mcdougal Larson Pre-algebra: Student Edition...AlgebraISBN:9780547587776Author:HOLT MCDOUGALPublisher:HOLT MCDOUGAL