Student's Solutions Manual For Statistical Reasoning For Everyday Life Format: Paperback
5th Edition
ISBN: 9780134456942
Author: Lund, Dave^bennett, Jeff^briggs, William L.^triola, Mario F.
Publisher: Prentice Hall
bartleby

Videos

Textbook Question
Book Icon
Chapter 10, Problem 1CRE

In Exercises 1–3, use the following service times (in seconds) observed at lunchtime at different fast-food restaurant drive-up windows. Assume that the service times for such restaurants are normally distributed.

Chapter 10, Problem 1CRE, In Exercises 13, use the following service times (in seconds) observed at lunchtime at different

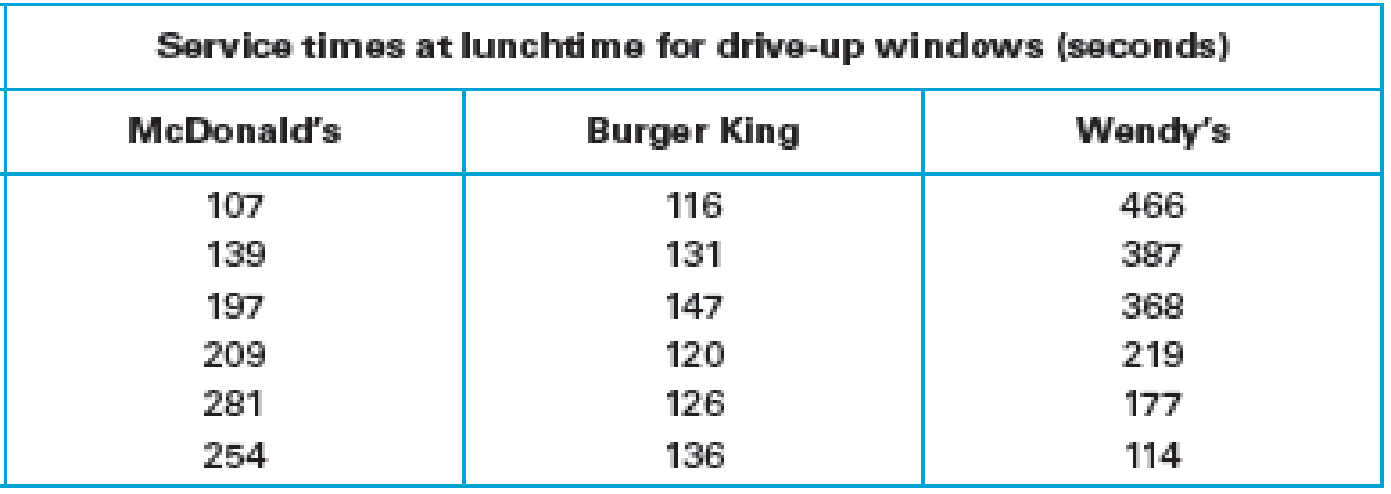
  1. 1. McDonald’s. Using only the service times from McDonald’s, construct a 95% confidence interval estimate of the population mean.
Expert Solution & Answer
Check Mark
To determine

Using the service times from McDonald’s obtain a 95% confidence interval to estimate the populations mean.

Answer to Problem 1CRE

The 95% confidence interval to estimate the population mean is (128.37,267.29).

Explanation of Solution

Calculation:

The data related to the service times at lunchtime for drive-up windows at McDonald’s.

t-distribution:

A random variable X is said to follow t distribution with degrees of freedom n1, if the probability density function of X is defined as,

f(x)=(1+x2n1)n1Γ(n2)(n1)πΓ(n12),<x< for n observations.

The value of random variable X can be defined as,

x=yzk, where the random variable y follows standard normal distribution and the random variable z follows chi-square distribution with degrees of freedom k.

Test statistic:

The test statistic is obtained as,

t=x¯μsn, where x¯ is the sample mean, μ is the population mean and s is the sample standard deviation.

Level of significance:

The level of significance is α=0.05.

For two tail test the level of significance is,

α2=0.052=0.025 .

The sample size is n=6.

Degrees of freedom:

The degrees of freedom for t distribution is n1.

Hence, the degrees of freedom for n=6 is,

df=n1=61=5

Critical value:

Step by step procedure to obtain the critical value from the TABLE 10.1: Critical t values, is obtained as:

  • Locate the degrees of freedom of 5 from the 1st column of TABLE 10.1.
  • Locate the area from the column of “0.05 area in two tails” corresponding to the degrees of freedom of 5.

The critical value is 2.571.

Mean:

Software procedure:

Step by step procedure using EXCEL to obtain Mean is given below:

  • Enter the name McDonald’s in the first cell A1 of an EXCEL sheet.
  • Enter the data value in that sheet corresponding to the heading McDonald’s from cell A2 to A7.
  • In cell A8 enter the formula “=AVERAGE(A2:A7)”.
  • Click Enter.

The output is given below:

Student's Solutions Manual For Statistical Reasoning For Everyday Life Format: Paperback, Chapter 10, Problem 1CRE , additional homework tip  1

Thus, the sample mean x¯ is approximately 197.83.

Standard deviation:

Software procedure:

Step by step procedure using EXCEL to obtain Standard deviation is given below:

  • Enter the name McDonald’s in the first cell A1 of an EXCEL sheet.
  • Enter the data value in that sheet corresponding to the heading McDonald’s from cell A2 to A7.
  • In cell A8 enter the formula “=STDEVA(A2:A7)”.
  • Click Enter.

The output is given below:

Student's Solutions Manual For Statistical Reasoning For Everyday Life Format: Paperback, Chapter 10, Problem 1CRE , additional homework tip  2

Thus, the sample standard deviation s is approximately 66.19.

Margin of error:

The margin of error, E is defined as,

E=t×sn, where t represents the critical value corresponding to the level of significance of 0.05 and s is the sample standard deviation.

The critical value is obtained as 2.571, the sample standard deviation is s=66.19 and sample size n=6.

Thus, the margin of error is,

E=(2.571)(66.19)6=170.17452.4569.46

Therefore, the margin of error is approximately 69.46

Confidence interval:

The 95% confidence interval around a sample mean to estimate the true value of population mean, μ, is obtained as, x¯E<μ<x¯+E.

Hence the confidence interval is,

(x¯±E)=(197.8369.46,197.83+69.46)=(128.37,267.29)

Thus, the 95% confidence interval to estimate the population mean is (128.37,267.29).

Want to see more full solutions like this?

Subscribe now to access step-by-step solutions to millions of textbook problems written by subject matter experts!

Chapter 10 Solutions

Student's Solutions Manual For Statistical Reasoning For Everyday Life Format: Paperback

Ch. 10.1 - Elbow-to-Fingertip Length of Men. A simple random...Ch. 10.1 - Earthquake Epicenter Depths. A simple random...Ch. 10.1 - Hospital Costs with Seat Belts. A study was...Ch. 10.1 - Prob. 14ECh. 10.1 - Estimating Car Pollution. Each car in a sample of...Ch. 10.1 - Movie Lengths. Listed below are lengths (in...Ch. 10.1 - Prob. 17ECh. 10.1 - Prob. 18ECh. 10.1 - Hypothesis Tests. In Exercises 1928, test the...Ch. 10.1 - Prob. 20ECh. 10.1 - Hypothesis Tests. In Exercises 1928, test the...Ch. 10.1 - Prob. 22ECh. 10.1 - Hypothesis Tests. In Exercises 1928, test the...Ch. 10.1 - Hypothesis Tests. In Exercises 1928, test the...Ch. 10.1 - Prob. 25ECh. 10.1 - Prob. 26ECh. 10.1 - Prob. 27ECh. 10.1 - Prob. 28ECh. 10.2 - Two-Way Tables. What is a two-way table? What are...Ch. 10.2 - Hypotheses. When working with two variables in a...Ch. 10.2 - Prob. 3ECh. 10.2 - Prob. 4ECh. 10.2 - Does It Make Sense? For Exercises 58, determine...Ch. 10.2 - Does It Make Sense? For Exercises 58, determine...Ch. 10.2 - Does It Make Sense? For Exercises 58, determine...Ch. 10.2 - Does It Make Sense? For Exercises 58, determine...Ch. 10.2 - Prob. 9ECh. 10.2 - Understanding a Two-Way Table Hypothesis Test....Ch. 10.2 - Survey Results. In Exercises 1114, assume that a...Ch. 10.2 - Survey Results. In Exercises 1114, assume that a...Ch. 10.2 - Survey Results. In Exercises 1114, assume that a...Ch. 10.2 - Survey Results. In Exercises 1114, assume that a...Ch. 10.2 - Prob. 15ECh. 10.2 - Complete Hypothesis Test. In Exercises 1522, carry...Ch. 10.2 - Complete Hypothesis Test. In Exercises 1522, carry...Ch. 10.2 - Complete Hypothesis Test. In Exercises 1522, carry...Ch. 10.2 - Complete Hypothesis Test. In Exercises 1522, carry...Ch. 10.2 - Prob. 20ECh. 10.2 - Prob. 21ECh. 10.2 - Prob. 22ECh. 10.3 - ANOVA. What does ANOVA stand for? What is the...Ch. 10.3 - Prob. 2ECh. 10.3 - Variance in ANOVA. Describe and distinguish...Ch. 10.3 - Test Statistic F. What is the meaning of small and...Ch. 10.3 - Prob. 5ECh. 10.3 - Prob. 6ECh. 10.3 - Does It Make Sense? For Exercises 58, determine...Ch. 10.3 - Does It Make Sense? For Exercises 58, determine...Ch. 10.3 - Prob. 9ECh. 10.3 - Comparing Colleges. A researcher obtains random...Ch. 10.3 - Readability of Authors. Samples of Flesch-Kincaid...Ch. 10.3 - Fabric Flammability Tests in Different...Ch. 10.3 - Prob. 13ECh. 10.3 - Pulse Rates. A random sample of adult females is...Ch. 10.3 - Using Technology. In Exercises 1518, use software...Ch. 10.3 - Using Technology. In Exercises 1518, use software...Ch. 10.3 - Prob. 17ECh. 10.3 - Using Technology. In Exercises 1518, use software...Ch. 10 - In Exercises 13, use the following service times...Ch. 10 - In Exercises 13, use the following service times...Ch. 10 - In Exercises 13, use the following service times...Ch. 10 - Prob. 4CRECh. 10 - Prob. 1CQCh. 10 - As part of the results from the test described in...Ch. 10 - For the hypothesis test described in Exercise 1,...Ch. 10 - A simple random sample of 25 blood platelet counts...Ch. 10 - Prob. 5CQCh. 10 - Prob. 6CQCh. 10 - Prob. 7CQCh. 10 - If the hypothesis test of the claim described in...Ch. 10 - A two-way table, constructed from survey results,...Ch. 10 - Prob. 10CQ
Knowledge Booster
Background pattern image
Statistics
Learn more about
Need a deep-dive on the concept behind this application? Look no further. Learn more about this topic, statistics and related others by exploring similar questions and additional content below.
Recommended textbooks for you
Text book image
MATLAB: An Introduction with Applications
Statistics
ISBN:9781119256830
Author:Amos Gilat
Publisher:John Wiley & Sons Inc
Text book image
Probability and Statistics for Engineering and th...
Statistics
ISBN:9781305251809
Author:Jay L. Devore
Publisher:Cengage Learning
Text book image
Statistics for The Behavioral Sciences (MindTap C...
Statistics
ISBN:9781305504912
Author:Frederick J Gravetter, Larry B. Wallnau
Publisher:Cengage Learning
Text book image
Elementary Statistics: Picturing the World (7th E...
Statistics
ISBN:9780134683416
Author:Ron Larson, Betsy Farber
Publisher:PEARSON
Text book image
The Basic Practice of Statistics
Statistics
ISBN:9781319042578
Author:David S. Moore, William I. Notz, Michael A. Fligner
Publisher:W. H. Freeman
Text book image
Introduction to the Practice of Statistics
Statistics
ISBN:9781319013387
Author:David S. Moore, George P. McCabe, Bruce A. Craig
Publisher:W. H. Freeman
Hypothesis Testing using Confidence Interval Approach; Author: BUM2413 Applied Statistics UMP;https://www.youtube.com/watch?v=Hq1l3e9pLyY;License: Standard YouTube License, CC-BY
Hypothesis Testing - Difference of Two Means - Student's -Distribution & Normal Distribution; Author: The Organic Chemistry Tutor;https://www.youtube.com/watch?v=UcZwyzwWU7o;License: Standard Youtube License