
Videos
Effect of Paternal Grandmother's Food Supply on Infant Mortality Widely available historical data on periods of famine show that before the industrial revolution, a failed harvest in one autumn often led to severe food shortages the following winter. Retrospective studies have correlated infant mortality with the abundance or food during a grandparent's child hood. FIGURE 10.11 shows results from one or these studies.
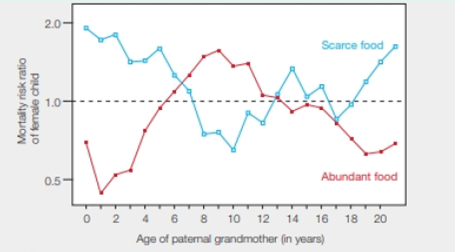
FIGURE 10.11 Relative risk of early death of female child, correlated with the age at which her paternal grandmother experienced a winter with a food supply, that was scarce (blue) or abundant (red) during childhood. The dotted line represents no difference in risk of mortality. A value above the line means increased risk; one below the line indicates reduced risk.
Compare the mortality risk of girls whose paternal grandmothers ate well at age 2 with girls whose grandmothers experienced famine at the same age. Which girl was more likely to die early? How much more likely was she to die?
To compare: The mortality risk of girls with the food habit of their parental grandmothers.
Introduction: The parental eating behavior has a great influence on the mortality rate of the offspring. The survival of the humans is greatly affected by the food scarcity faced by their ancestors. An individual who has faced famine or starvation at a particular period can be correlated with the infant mortality rate.
Explanation of Solution
As given in Fig. 10.11, “Relative risk of early death of a female child” can be correlated with the age of her parental grandmother food scarcity or food abundance.
According to the given data, during the industrial revolution, a food shortage was experienced in winter due to the failure in harvesting in the autumn season.
The given graph shows, the age of parental grandmother in X- axis and mortality risk ratio of the female child in the Y- axis. The blue line in the graph depicts the mortality rate and parental grandmother who faced food scarcity at the different age. And the red line in the graph depicts the mortality rate and parental grandmother who has abundant of food at the different age. A dotted line which given in the graph represents that there is no difference in the risk of mortality. If the value goes above the dotted line, the risk increases and value below the line the risk decreases.
A comparison is done between the mortality risks of girls correlated with the eating habits of their parental grandmother at the age 2. According to the given graph, a girl whose grandmother experienced food crisis at the age of two is more likely to die earlier than the girl whose parental grandmother got abundant food at the age of 2. The female grandchild’s mortality risk ratio is one and one and half time greater than the average.
The girl child whose parental grandmother faced food crisis at age 2 is one and one-half times more likely to die early.
Want to see more full solutions like this?
Chapter 10 Solutions
Biology: The Unity and Diversity of Life
Additional Science Textbook Solutions
SEELEY'S ANATOMY+PHYSIOLOGY
Campbell Biology in Focus (2nd Edition)
Campbell Biology in Focus
Human Anatomy
Essentials of Human Anatomy & Physiology (12th Edition)
Laboratory Experiments in Microbiology (11th Edition)


- Measuring Genetic Diversity in Human Populations Why is it that mutation, acting alone, has little effect on gene frequency?arrow_forwardMeasuring Genetic Diversity in Human Populations How would a drastic reduction in a populations size affect that populations gene pool?arrow_forwardDog variation or fish variation - explain how these variations appearance affect their fitness-the rate of survival and reproduction.arrow_forward
- Mortality due to lung cancer was followed ingroups of males in the United Kingdom for 50 years. FigureQ20–1 shows the cumulative risk of dying from lung can-cer as a function of age and smoking habits for four groupsof males: those who never smoked, those who stopped atage 30, those who stopped at age 50, and those who contin-ued to smoke. These data show clearly that individuals cansubstantially reduce their cumulative risk of dying fromlung cancer by stopping smoking. What do you suppose isthe biological basis for this observation?arrow_forwardNapoleon Dynamite’s favorite animal is a liger, a cross between a lion and a tiger. Although both are hybrids, ligers can reproduce while mules cannot. Provide a scientific explanation for this difference in fertility.arrow_forwardHow breeding of animals and plant crops affects the lives of most people from then till now?arrow_forward
- Role of chance and direction in evolution and in determining the phenotype of a populationarrow_forwardallele frequencies in the rainy seasonarrow_forwardBirth Defects and Multiple Births A woman who carries multiple offspring at the same time increases the risk of some birth defects. FIGURE 42.18 shows the results of Yiwei Tang's study of birth defects reported in Florida from 1W6 to 2000. Tang compared the incidence of various defects among single and multiple births. She calculated the relative risk for each type of defect based on type of birth, and corrected for other differences that might increase risk such as maternal age, income, race, and medical care during pregnancy. A relative risk of less than 1 means that multiple births pose less risk of that defect occurring. A relative risk greater than 1 means multiples are more likely to have a defect. FIGURE 42.18 Prevalence, per 10,000 live births, of various types of birth defects among multiple aria single births. Relative risk for each defect is given after researches adjusted for the motor's age, race, previous adverse pregnancy experience, education, Medicaid participation during pregnancy, as well as the infant's sex and number of siblings. 4. Does a multiple pregnancy increase the relative risk of chromosomal defects in offspring?arrow_forward
- In a large population of chimpanzees, there is a recessive genetic condition telactalase (fictional). Assume the Hardy-Weinberg distribution. If the frequency of dominant allele is 0.77 then what fraction of the population has telactalase ? Giver your answer with four digits parts the decimal point.arrow_forward11. A small group of finches from the mainland United States get blown off course during a hurricane and are focused to settle on an island off the coast of Georgia. Most of these birds have a recessive trait for yellow spots on their wings which is not a common trait among this speciet. Over several generations the entire population of these finches on the island have this expressive trait. This is an example of ____.arrow_forwardWhen people move to hot climates, their bodies increase sweat production to manage the heat-induced body stress. This increase in sweat production is passed on to their offspring. In other words, their offspring would display high sweat production as a result of descending from high sweat-producing parents. Question 3 a. True b. Falsearrow_forward
 Biology Today and Tomorrow without Physiology (Mi...BiologyISBN:9781305117396Author:Cecie Starr, Christine Evers, Lisa StarrPublisher:Cengage Learning
 Biology: The Unity and Diversity of Life (MindTap...BiologyISBN:9781305073951Author:Cecie Starr, Ralph Taggart, Christine Evers, Lisa StarrPublisher:Cengage Learning
 Biology: The Unity and Diversity of Life (MindTap...BiologyISBN:9781337408332Author:Cecie Starr, Ralph Taggart, Christine Evers, Lisa StarrPublisher:Cengage Learning
 Human Heredity: Principles and Issues (MindTap Co...BiologyISBN:9781305251052Author:Michael CummingsPublisher:Cengage Learning
 Biology: The Dynamic Science (MindTap Course List)BiologyISBN:9781305389892Author:Peter J. Russell, Paul E. Hertz, Beverly McMillanPublisher:Cengage Learning