
Concept explainers
Videos
(a)
To Explain: the re-expression for the following possible residuals plots.
(a)
Explanation of Solution
Given:
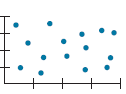
By seeing the plot, it is observed that the pattern is linear, it is appropriate for the data. Therefore, re-expression of the data is not needed.
(b)
To Explain: the re-expression for the following possible residuals plots.
(b)
Explanation of Solution
Given:
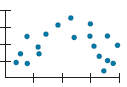
By seeing the plot, it is observed that the pattern is curved. Therefore, linear model is not appropriate for the given data. So re-expression of the data is needed to making the relationship straighten.
(c)
To Explain: the re-expression for the following possible residuals plots.
(c)
Explanation of Solution
Given:
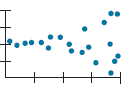
By seeing the plot, it is observed that the plot is spread. Therefore the linear model is not appropriate for the data list. So, re-expression of data is needed to making the spread equal.
Want to see more full solutions like this?
Chapter 10 Solutions
Stats: Modeling the World Nasta Edition Grades 9-12
Additional Math Textbook Solutions
Intro Stats, Books a la Carte Edition (5th Edition)
Statistics for Psychology
Introductory Statistics
Introductory Statistics
Elementary Statistics: Picturing the World (6th Edition)
Elementary Statistics Using Excel (6th Edition)


 MATLAB: An Introduction with ApplicationsStatisticsISBN:9781119256830Author:Amos GilatPublisher:John Wiley & Sons Inc
 Probability and Statistics for Engineering and th...StatisticsISBN:9781305251809Author:Jay L. DevorePublisher:Cengage Learning
 Statistics for The Behavioral Sciences (MindTap C...StatisticsISBN:9781305504912Author:Frederick J Gravetter, Larry B. WallnauPublisher:Cengage Learning
 Elementary Statistics: Picturing the World (7th E...StatisticsISBN:9780134683416Author:Ron Larson, Betsy FarberPublisher:PEARSON
 The Basic Practice of StatisticsStatisticsISBN:9781319042578Author:David S. Moore, William I. Notz, Michael A. FlignerPublisher:W. H. Freeman
 Introduction to the Practice of StatisticsStatisticsISBN:9781319013387Author:David S. Moore, George P. McCabe, Bruce A. CraigPublisher:W. H. Freeman