MATH W/APPLICAT.W/NOTES GDE +ACCESS CODE
11th Edition
ISBN: 9781323751671
Author: Lial
Publisher: PEARSON C
bartleby

Concept explainers

bartleby

Videos

Textbook Question
Book Icon
Chapter 10, Problem 1RE

NASDAQ 100 Stocks For Exercises 1-10, the data come from a random sample of 20 companies of the NASDAQ 100 taken on June 8, 2017. (Data from: www.morningstar.com.)

For Exercises 1 and 2, (a) write a frequency distribution; (b) draw a histogram.

The variable is the price of the stock (rounded to the nearest dollar).

123 35 76 38
45 62 50 111
180 108 65 46
66 100 64 144
57 107 48 110

(a)

Expert Solution
Check Mark
To determine
Find the frequency table corresponding to the data came from a random sample of 20 companies of NASDAQ 100.

Explanation of Solution

Given:

Consider the data came from a random sample of 20 companies of NASDAQ 100

123 35 76 38
45 62 50 111
180 108 65 46
66 100 64 144
57 107 48 110

Calculation:

To draw the frequency table, sort the data set

35,38,45, 46,48,50,57,62,64,65,66,76,100,107,108,110,111,123,144,180

There is no repetition of data therefore the frequency of occurrence is 1 for all the data set hence the frequency distribution is

xi fi xi fi
35 1 66 1
38 1 76 1
45 1 100 1
46 1 107 1
48 1 108 1
50 1 110 1
57 1 111 1
62 1 123 1
64 1 144 1
65 1 180 1

(b)

Expert Solution
Check Mark
To determine

To graph: Draw the histogram corresponding to the corresponding to the data came from a random sample of 20 companies of NASDAQ 100.

Explanation of Solution

Given:

Consider the data came from a random sample of 20 companies of NASDAQ 100

123 35 76 38
45 62 50 111
180 108 65 46
66 100 64 144
57 107 48 110

Calculation:

To draw the frequency table sort the data set

35,38,45, 46,48,50,57,62,64,65,66,76,100,107,108,110,111,123,144,180

There is no repetition of data therefore the frequency of occurrence is 1 for all the data set hence the frequency distribution is

xi fi xi fi
35 1 66 1
38 1 76 1
45 1 100 1
46 1 107 1
48 1 108 1
50 1 110 1
57 1 111 1
62 1 123 1
64 1 144 1
65 1 180 1
Range Frequency
20-40 2
40-60 5
60-80 5
80-100 0
100-120 5
120-140 1
140-160 1
160-180 0
180-200 1

The y-axis represents frequency with a scale of 1 unit of y=1 and the x-axis represents price with a scale of 1 unit of x=$20.

MATH W/APPLICAT.W/NOTES GDE +ACCESS CODE, Chapter 10, Problem 1RE

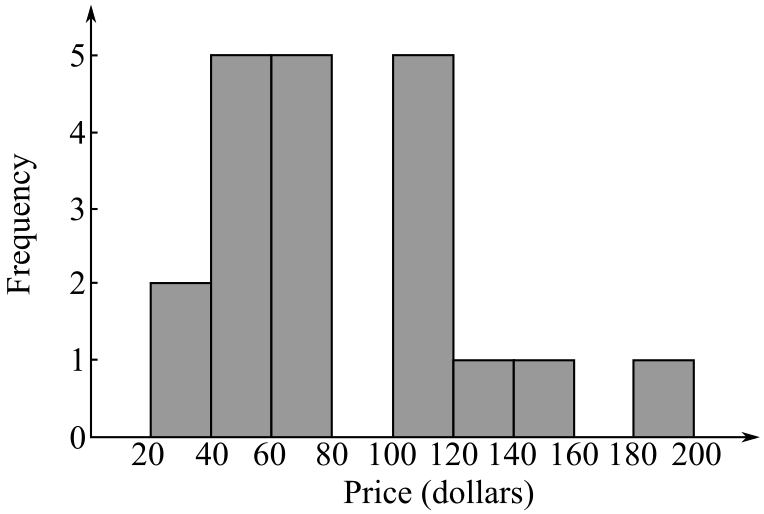
Hence, the histogram corresponding to the corresponding to the data came from a random sample of 20 companies of NASDAQ 100 is drawn.

Want to see more full solutions like this?

Subscribe now to access step-by-step solutions to millions of textbook problems written by subject matter experts!

Chapter 10 Solutions

MATH W/APPLICAT.W/NOTES GDE +ACCESS CODE

Ch. 10.1 - The data for Exercises 5-10 consist of random...Ch. 10.1 - The data for Exercises 5-10 consist of random...Ch. 10.1 - The data for Exercises 5-10 consist of random...Ch. 10.1 - The data for Exercises 5-10 consist of random...Ch. 10.1 - The data for Exercises 5-10 consist of random...Ch. 10.1 - For Exercises 11-20, construct a stem-and-leaf...Ch. 10.1 - For Exercises 11-20, construct a stem-and-leaf...Ch. 10.1 - For Exercises 11-20, construct a stem-and-leaf...Ch. 10.1 - Prob. 14ECh. 10.1 - For Exercises 11-20, construct a stem-and-leaf...Ch. 10.1 - For Exercises 11-20, construct a stem-and-leaf...Ch. 10.1 - Prob. 17ECh. 10.1 - Prob. 18ECh. 10.1 - For Exercises 11-20, construct a stem-and-leaf...Ch. 10.1 - For Exercises 11-20, construct a stem-and-leaf...Ch. 10.1 - Describe the shape of each of the given...Ch. 10.1 - Describe the shape of each of the given...Ch. 10.1 - Describe the shape of each of the given...Ch. 10.1 - Describe the shape of each of the given...Ch. 10.1 - Student Loan Defaults The following histogram...Ch. 10.1 - Stocks The following histogram shows the stock...Ch. 10.1 - Cat Ownership The stem-and-leaf plot below...Ch. 10.1 - Personal Bankruptcies The stem-and-leaf plot below...Ch. 10.1 - 29. Test Scores The grade distribution for scores...Ch. 10.1 - 30. Test Scores The grade distribution for scores...Ch. 10.2 - Checkpoint 1 Find the mean dollar amount of the...Ch. 10.2 - Checkpoint 2 Find for the following frequency...Ch. 10.2 - Checkpoint 3 Find the mean of the following...Ch. 10.2 - Checkpoint 4 Find the mean for the college tuition...Ch. 10.2 - Checkpoint 5 Find the median for the given heights...Ch. 10.2 - Checkpoint 6 Find the mode for each of the given...Ch. 10.2 - Checkpoint 7 Following is a list of the number of...Ch. 10.2 - Prob. 8CPCh. 10.2 - Prob. 1ECh. 10.2 - Prob. 2ECh. 10.2 - Prob. 3ECh. 10.2 - Prob. 4ECh. 10.2 - Prob. 5ECh. 10.2 - Prob. 6ECh. 10.2 - Prob. 7ECh. 10.2 - Prob. 8ECh. 10.2 - Prob. 9ECh. 10.2 - Prob. 10ECh. 10.2 - Prob. 11ECh. 10.2 - Prob. 12ECh. 10.2 - Prob. 13ECh. 10.2 - Prob. 14ECh. 10.2 - Find the mode or modes for each of the given lists...Ch. 10.2 - Find the mode or modes for each of the given lists...Ch. 10.2 - Find the mode or modes for each of the given lists...Ch. 10.2 - Find the mode or modes for each of the given lists...Ch. 10.2 - Find the mode or modes for each of the given lists...Ch. 10.2 - 20. When is the median the most appropriate...Ch. 10.2 - 21. When would the mode be an appropriate measure...Ch. 10.2 - Pet Ownership For Exercises 22 and 23, the...Ch. 10.2 - Pet Ownership For Exercises 22 and 23, the...Ch. 10.2 - 24. To predict the outcome of the next...Ch. 10.2 - Work each problem. (See Example 6.) MLB Payrolls...Ch. 10.2 - Work each problem. (See Example 6.) NFL Team...Ch. 10.2 - Work each problem. (See Example 6.) 27. Business...Ch. 10.2 - Work each problem. (See Example 6.) Sirius XM...Ch. 10.2 - Work each problem. (See Example 6.) Dr Pepper and...Ch. 10.2 - Natural Science The table gives the average...Ch. 10.2 - Natural Science The table gives the average...Ch. 10.2 - For Exercises 32-33 determine the shape of the...Ch. 10.2 - For Exercises 32-33 determine the shape of the...Ch. 10.2 - Prob. 34ECh. 10.2 - Prob. 35ECh. 10.2 - For Exercises 36-38, calculate the weighted...Ch. 10.2 - For Exercises 36-38, calculate the weighted...Ch. 10.2 - For Exercises 36-38, calculate the weighted...Ch. 10.2 - Prob. 39ECh. 10.2 - For Exercises 36-38, calculate the weighted...Ch. 10.3 - Checkpoint 1 Find the range for this sample of the...Ch. 10.3 - Checkpoint 2 Find the deviations from the mean for...Ch. 10.3 - Checkpoint 3 Find the standard deviation for a...Ch. 10.3 - Prob. 4CPCh. 10.3 - Prob. 1ECh. 10.3 - Prob. 2ECh. 10.3 - Prob. 3ECh. 10.3 - Prob. 4ECh. 10.3 - Prob. 5ECh. 10.3 - Prob. 6ECh. 10.3 - Prob. 7ECh. 10.3 - Finance Use the following table for Exercises...Ch. 10.3 - Finance Use the following table for Exercises...Ch. 10.3 - Prob. 10ECh. 10.3 - Education Find the standard deviation for the...Ch. 10.3 - Prob. 12ECh. 10.3 - Prob. 13ECh. 10.3 - Prob. 14ECh. 10.3 - Prob. 15ECh. 10.3 - Prob. 16ECh. 10.3 - Prob. 17ECh. 10.3 - Prob. 18ECh. 10.3 - Prob. 19ECh. 10.3 - Prob. 20ECh. 10.3 - Prob. 21ECh. 10.3 - Prob. 22ECh. 10.3 - Prob. 23ECh. 10.3 - Movie Studios' Revenue For Exercises 23-28, use...Ch. 10.3 - Prob. 25ECh. 10.3 - Prob. 26ECh. 10.3 - Prob. 27ECh. 10.3 - Prob. 28ECh. 10.3 - Prob. 29ECh. 10.3 - Prob. 30ECh. 10.3 - Prob. 34ECh. 10.3 - Prob. 31ECh. 10.3 - Prob. 32ECh. 10.3 - Prob. 33ECh. 10.3 - IBM and Microsoft Revenue The following table...Ch. 10.3 - Prob. 36ECh. 10.3 - Prob. 37ECh. 10.3 - Prob. 38ECh. 10.3 - IBM and Microsoft Revenue The following table...Ch. 10.3 - Prob. 40ECh. 10.3 - Prob. 41ECh. 10.3 - Prob. 42ECh. 10.3 - Prob. 43ECh. 10.3 - Prob. 44ECh. 10.3 - Prob. 45ECh. 10.3 - Prob. 46ECh. 10.3 - Prob. 47ECh. 10.3 - Prob. 48ECh. 10.4 - Prob. 1CPCh. 10.4 - Prob. 2CPCh. 10.4 - Prob. 3CPCh. 10.4 - Prob. 4CPCh. 10.4 - Prob. 5CPCh. 10.4 - Prob. 6CPCh. 10.4 - Prob. 7CPCh. 10.4 - 1. The peak in a normal curve occurs directly...Ch. 10.4 - Prob. 2ECh. 10.4 - Prob. 3ECh. 10.4 - Prob. 4ECh. 10.4 - Prob. 5ECh. 10.4 - Prob. 6ECh. 10.4 - Prob. 7ECh. 10.4 - Prob. 8ECh. 10.4 - Find the percentage of the total area under the...Ch. 10.4 - Prob. 10ECh. 10.4 - Prob. 11ECh. 10.4 - Prob. 12ECh. 10.4 - Prob. 13ECh. 10.4 - Prob. 14ECh. 10.4 - Prob. 15ECh. 10.4 - Prob. 16ECh. 10.4 - Prob. 17ECh. 10.4 - Prob. 18ECh. 10.4 - Prob. 19ECh. 10.4 - 20. Using Chebyshev’s theorem and the normal...Ch. 10.4 - Prob. 21ECh. 10.4 - Prob. 22ECh. 10.4 - Prob. 23ECh. 10.4 - Prob. 24ECh. 10.4 - Prob. 25ECh. 10.4 - Prob. 26ECh. 10.4 - Prob. 27ECh. 10.4 - Prob. 28ECh. 10.4 - Prob. 29ECh. 10.4 - Prob. 30ECh. 10.4 - Prob. 31ECh. 10.4 - Prob. 32ECh. 10.4 - Prob. 33ECh. 10.4 - Prob. 34ECh. 10.4 - Prob. 35ECh. 10.4 - Prob. 36ECh. 10.4 - Prob. 37ECh. 10.4 - Prob. 38ECh. 10.4 - Prob. 39ECh. 10.4 - Prob. 40ECh. 10.4 - Prob. 41ECh. 10.4 - Prob. 42ECh. 10.4 - Prob. 43ECh. 10.4 - Prob. 44ECh. 10.4 - Prob. 45ECh. 10.4 - Prob. 46ECh. 10.4 - Prob. 47ECh. 10.4 - Prob. 48ECh. 10.4 - Prob. 49ECh. 10.4 - Education The mean performance score of a large...Ch. 10.4 - Prob. 51ECh. 10.4 - Prob. 52ECh. 10.4 - Job Satisfaction According to a 2016 study...Ch. 10.4 - Prob. 54ECh. 10.4 - Prob. 55ECh. 10.4 - Prob. 56ECh. 10.4 - Prob. 57ECh. 10.4 - Prob. 58ECh. 10.4 - Student Loan Debt According to a report from the...Ch. 10.4 - Prob. 60ECh. 10.4 - Prob. 61ECh. 10.4 - Prob. 62ECh. 10 - NASDAQ 100 Stocks For Exercises 1-10, the data...Ch. 10 - Prob. 2RECh. 10 - Prob. 3RECh. 10 - Prob. 4RECh. 10 - Prob. 5RECh. 10 - Prob. 6RECh. 10 - NASDAQ 100 Stocks For Exercises 1-10, the data...Ch. 10 - Prob. 8RECh. 10 - Prob. 9RECh. 10 - Prob. 10RECh. 10 - Prob. 11RECh. 10 - Prob. 12RECh. 10 - Prob. 13RECh. 10 - Prob. 14RECh. 10 - Prob. 15RECh. 10 - Prob. 16RECh. 10 - Prob. 17RECh. 10 - Prob. 18RECh. 10 - Prob. 19RECh. 10 - Prob. 20RECh. 10 - Prob. 21RECh. 10 - Prob. 22RECh. 10 - Prob. 23RECh. 10 - Prob. 24RECh. 10 - Find the standard deviation for each of the given...Ch. 10 - Prob. 26RECh. 10 - Prob. 27RECh. 10 - Prob. 28RECh. 10 - Prob. 29RECh. 10 - Prob. 30RECh. 10 - Prob. 31RECh. 10 - Prob. 32RECh. 10 - Prob. 33RECh. 10 - Prob. 34RECh. 10 - Prob. 35RECh. 10 - Prob. 36RECh. 10 - Arm Circumference Data from a recent National...Ch. 10 - Prob. 38RECh. 10 - Prob. 39RECh. 10 - Prob. 40RECh. 10 - Prob. 41RECh. 10 - Prob. 42RECh. 10 - Prob. 43RECh. 10 - Prob. 44RECh. 10 - Prob. 45RECh. 10 - Prob. 46RECh. 10 - Prob. 47RECh. 10 - College or University Education A recent...Ch. 10 - College or University Education A recent...Ch. 10 - Prob. 50RECh. 10 - Prob. 51RECh. 10 - Prob. 52RECh. 10 - Prob. 53RECh. 10 - Prob. 54RECh. 10 - Prob. 1CECh. 10 - Prob. 2CECh. 10 - Prob. 3CECh. 10 - Prob. 4CECh. 10 - Prob. 5CECh. 10 - Prob. 6CECh. 10 - Prob. 7CECh. 10 - Prob. 8CECh. 10 - Prob. 9CECh. 10 - Prob. 10CE
Knowledge Booster
Background pattern image
Math
Learn more about
Need a deep-dive on the concept behind this application? Look no further. Learn more about this topic, subject and related others by exploring similar questions and additional content below.
Recommended textbooks for you
Text book image
Glencoe Algebra 1, Student Edition, 9780079039897...
Algebra
ISBN:9780079039897
Author:Carter
Publisher:McGraw Hill
Text book image
Big Ideas Math A Bridge To Success Algebra 1: Stu...
Algebra
ISBN:9781680331141
Author:HOUGHTON MIFFLIN HARCOURT
Publisher:Houghton Mifflin Harcourt
The Shape of Data: Distributions: Crash Course Statistics #7; Author: CrashCourse;https://www.youtube.com/watch?v=bPFNxD3Yg6U;License: Standard YouTube License, CC-BY
Shape, Center, and Spread - Module 20.2 (Part 1); Author: Mrmathblog;https://www.youtube.com/watch?v=COaid7O_Gag;License: Standard YouTube License, CC-BY
Shape, Center and Spread; Author: Emily Murdock;https://www.youtube.com/watch?v=_YyW0DSCzpM;License: Standard Youtube License