
Concept explainers
Videos
A.
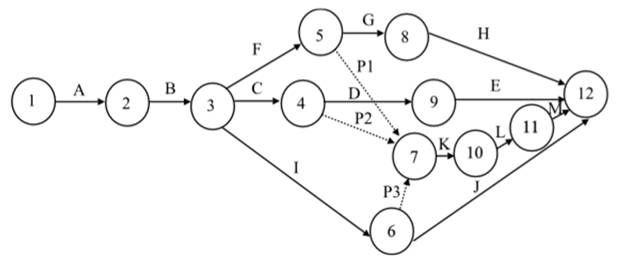
Interpretation: A network diagram representing the activities of the project is to be constructed.
Concept Introduction: Network diagram is a graphical representation of tasks and events happening in a project. It depicts the work flow and is used to compute the total duration of the project.
A.
Explanation of Solution
Given information: Theactivities to be taken up for the construction of a gas station and the time duration for each are given in the table.
| Activity | Time |
| A | 4 |
| B | 2 |
| C | 3 |
| D | 1 |
| E | 1 |
| F | 2 |
| G | 3 |
| H | 1 |
| I | 5 |
| J | 3 |
| K | 4 |
| L | 2 |
| M | 1 |
The activity times and the precedence relationship are shown in the table:
| Activity | Time | Predecessors |
| A | 4 | |
| B | 2 | A |
| C | 3 | B |
| D | 1 | C |
| E | 1 | D |
| F | 2 | B |
| G | 3 | F |
| H | 1 | G |
| I | 5 | B |
| J | 3 | I |
| K | 4 | C, F, I |
| L | 2 | K |
| M | 1 | L |
The network diagram showing the work flows is as follows:
B.
Interpretation: The critical path is to be identified by computing the earliest and the latest start and finish times.
Concept Introduction: Network diagram is a graphical representation of tasks and events happening in a project. It depicts the work flow and is used to compute the total duration of the project.
B.
Answer to Problem 26AP
The critical path is A − B − I − K − L − M with completion time as 18 weeks
Explanation of Solution
Given information:
| Activity | Time |
| A | 4 |
| B | 2 |
| C | 3 |
| D | 1 |
| E | 1 |
| F | 2 |
| G | 3 |
| H | 1 |
| I | 5 |
| J | 3 |
| K | 4 |
| L | 2 |
| M | 1 |

The earliest and latest start and finish times are calculated using the formulae:
Earliest Start (EST) = Maximum EFT of the predecessor activity
Latest Start (LST) = LFT - Duration
Earliest Finish (EFT) = EST + Duration
Latest Finish (LFT) = Minimum LST of the immediate successor
Slack = LFT − EFT (or) LST − EST
| Activity | Time | EST | EFT | LST | LFT | Slack |
| A | 4 | 0 | 4 | 0 | 4 | 0 |
| B | 2 | 4 | 6 | 4 | 6 | 0 |
| C | 3 | 6 | 9 | 8 | 11 | 2 |
| D | 1 | 9 | 10 | 16 | 17 | 7 |
| E | 1 | 10 | 11 | 17 | 18 | 7 |
| F | 2 | 6 | 8 | 9 | 11 | 3 |
| G | 3 | 8 | 11 | 14 | 17 | 6 |
| H | 1 | 11 | 12 | 17 | 18 | 6 |
| I | 5 | 6 | 11 | 6 | 11 | 0 |
| J | 3 | 11 | 14 | 15 | 18 | 4 |
| K | 4 | 11 | 15 | 11 | 15 | 0 |
| L | 2 | 15 | 17 | 15 | 17 | 0 |
| M | 1 | 17 | 18 | 17 | 18 | 0 |
The critical path includes the activities with zero slack. So, here the critical path is A − B− I − K − L − M. The total time taken to complete the project is 18 weeks.
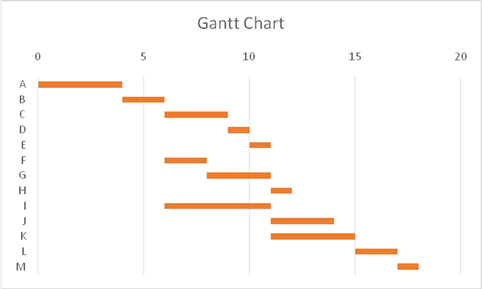
C.
Interpretation: A Gantt chart of the
Concept Introduction: Gantt chart is a project management tool that is a type of bar chart. It depicts the project schedule and is used for resource allocation.
C.
Answer to Problem 26AP
A Gantt chart for the project has been drawn.
Explanation of Solution
Given information:
| Activity | Time |
| A | 4 |
| B | 2 |
| C | 3 |
| D | 1 |
| E | 1 |
| F | 2 |
| G | 3 |
| H | 1 |
| I | 5 |
| J | 3 |
| K | 4 |
| L | 2 |
| M | 1 |
Activity times and early start times:
| Activity | EST | Time |
| A | 0 | 4 |
| B | 4 | 2 |
| C | 6 | 3 |
| D | 9 | 1 |
| E | 10 | 1 |
| F | 6 | 2 |
| G | 8 | 3 |
| H | 11 | 1 |
| I | 6 | 5 |
| J | 11 | 3 |
| K | 11 | 4 |
| L | 15 | 2 |
| M | 17 | 1 |
The Gantt chart depicting the project based on the EST:
D.
Interpretation: The impact of replacement of the air compressor which takes two weeks on the completion of the project is to be determined.
Concept Introduction: Network diagram is a graphical representation of tasks and events happening in a project. It depicts the work flow and is used to compute the total duration of the project.
D.
Explanation of Solution
Given information:
| Activity | Time |
| A | 4 |
| B | 2 |
| C | 3 |
| D | 1 |
| E | 1 |
| F | 2 |
| G | 3 |
| H | 1 |
| I | 5 |
| J | 3 |
| K | 4 |
| L | 2 |
| M | 1 |
Installing the air compressor is represented by activity G.
| Activity | Time | EST | EFT | LST | LFT | Slack |
| A | 4 | 0 | 4 | 0 | 4 | 0 |
| B | 2 | 4 | 6 | 4 | 6 | 0 |
| C | 3 | 6 | 9 | 8 | 11 | 2 |
| D | 1 | 9 | 10 | 16 | 17 | 7 |
| E | 1 | 10 | 11 | 17 | 18 | 7 |
| F | 2 | 6 | 8 | 9 | 11 | 3 |
| G | 3 | 8 | 11 | 14 | 17 | 6 |
| H | 1 | 11 | 12 | 17 | 18 | 6 |
| I | 5 | 6 | 11 | 6 | 11 | 0 |
| J | 3 | 11 | 14 | 15 | 18 | 4 |
| K | 4 | 11 | 15 | 11 | 15 | 0 |
| L | 2 | 15 | 17 | 15 | 17 | 0 |
| M | 1 | 17 | 18 | 17 | 18 | 0 |
The latest start time of the activity G is 14th week. If the failure is identified before installation, the project will not be delayed as the replacement time (2 weeks) is less than the slack (6 weeks).
If the failure is found during testing of the air compressor, represented by activity H, still the project would not be delayed, as again there is a slack of 6 weeks.
E.
Interpretation: The activities that can be completed by the end of the 15th week without delaying the project completion are to be determined.
Concept Introduction: Network diagram is a graphical representation of tasks and events happening in a project. It depicts the work flow and is used to compute the total duration of the project.
E.
Answer to Problem 26AP
The activities A, B, C, F and I have to be completed by the end of the 15th week to guarantee project completion without delay.
Explanation of Solution
Given information:
| Activity | Time |
| A | 4 |
| B | 2 |
| C | 3 |
| D | 1 |
| E | 1 |
| F | 2 |
| G | 3 |
| H | 1 |
| I | 5 |
| J | 3 |
| K | 4 |
| L | 2 |
| M | 1 |
The table shows the Earliest and Latest times of the activities
| Activity | Time | EST | EFT | LST | LFT | Slack |
| A | 4 | 0 | 4 | 0 | 4 | 0 |
| B | 2 | 4 | 6 | 4 | 6 | 0 |
| C | 3 | 6 | 9 | 8 | 11 | 2 |
| D | 1 | 9 | 10 | 16 | 17 | 7 |
| E | 1 | 10 | 11 | 17 | 18 | 7 |
| F | 2 | 6 | 8 | 9 | 11 | 3 |
| G | 3 | 8 | 11 | 14 | 17 | 6 |
| H | 1 | 11 | 12 | 17 | 18 | 6 |
| I | 5 | 6 | 11 | 6 | 11 | 0 |
| J | 3 | 11 | 14 | 15 | 18 | 4 |
| K | 4 | 11 | 15 | 11 | 15 | 0 |
| L | 2 | 15 | 17 | 15 | 17 | 0 |
| M | 1 | 17 | 18 | 17 | 18 | 0 |
The latest finish times of the activities A, B, C, F and Iam less than 15 weeks. Therefore, these activities have to be completed by the end of the 15th weeks to guarantee project completion without any delay.
F.
Interpretation: The optimal solution for the problem is to be determined using linear programming.
Concept Introduction: Linear programming is a mathematical technique used to achieve the best outcome, given a list of parameters usually restrictions on the resources.
F.
Answer to Problem 26AP
The optimal solution for the problem is obtained using linear programming.
Explanation of Solution
Given information:
| Activity | Time |
| A | 4 |
| B | 2 |
| C | 3 |
| D | 1 |
| E | 1 |
| F | 2 |
| G | 3 |
| H | 1 |
| I | 5 |
| J | 3 |
| K | 4 |
| L | 2 |
| M | 1 |
The various paths of the project and the durations are:
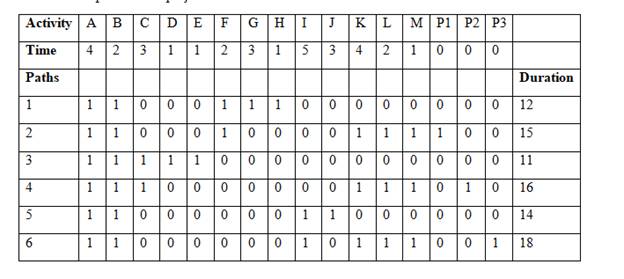
The critical path is A − B − I − K − L − M with the completion time of 18 weeks.
Using linear programming, the EST is calculated.
Objective function = =SUM (B2:M2)
| Nodes | 1 | 2 | 3 | 4 | 5 | 6 | 7 | 8 | 9 | 10 | 11 | 12 |
| EST |
The constraints
| Activity | Time | ||
| A | 0 | > | 4 |
| B | 0 | > | 2 |
| C | 0 | > | 3 |
| D | 0 | > | 1 |
| E | 0 | > | 1 |
| F | 0 | > | 2 |
| G | 0 | > | 3 |
| H | 0 | > | 1 |
| I | 0 | > | 5 |
| J | 0 | > | 3 |
| K | 0 | > | 4 |
| L | 0 | > | 2 |
| M | 0 | > | 1 |
| P1 | 0 | > | 0 |
| P2 | 0 | > | 0 |
| P3 | 0 | > | 0 |
Solver Solution:
| Objective Function |
| 120 |
EST for the nodes:
| Nodes | 1 | 2 | 3 | 4 | 5 | 6 | 7 | 8 | 9 | 10 | 11 | 12 |
| EST | 0 | 4 | 6 | 9 | 8 | 11 | 11 | 11 | 10 | 15 | 17 | 18 |
Want to see more full solutions like this?
Chapter 10 Solutions
Production and Operations Analysis, Seventh Edition


- Brooke Bentley, a student in business administration, is trying to decide which management science course to take next quarter—I, II, or III. “Steamboat” Fulton, “ Death” Ray, and “Sadistic” Scott are the three management science professors who teach the courses. Brooke does not know who will teach what course. Brooke can expect a different grade in each of the courses, depending on who teaches it next quarter, as shown in the following payoff table: Professor Course Fulton Ray Scott I B D D II C B F III F A…arrow_forwardThe Topeka Twisters were founded as a professional football team in 1995. The team has played all of its home games at TOPPS STADIUM since the formation of the team. The Twisters also have shared TOPPS STADIUM with the city’s professional baseball team. The Topeka Twisters’ Owners are dissatisfied with the stadium situation and the stadium conditions in Topeka and are seeking to relocate the Twisters to another city. Topeka’s city officials are disappointed with the Twisters’ Owners’ desire to relocate to another city and want to persuade the Owners to keep the Twisters in Topeka. The team owners and city officials have agreed to meet on November 29, 2022 to negotiate the terms of a new agreement for the Twisters to stay in Topeka. If an agreement cannot be reached the team’s intentions are to relocate to another city. The team has not disclosed whether or not it has another city that is interested in bringing a professional football team to its city. How would a negotiation report be…arrow_forwardBaseball's World Series is a maximum of seven games, with the winner being the first team to win four games. Assume that the Atlanta Braves are playing the Minnesota Twins in the World Series and that the first two games are to be played in Atlanta, the next three games at the Twins' ballpark, and the last two games, if necessary, back in Atlanta. Taking into account the projected starting pitchers for each game and the home field advantage, the probabilities of Atlanta winning each game are as follows: Game 1 2 3 4 5 6 7 Probability of Win 0.7 0.45 0.49 0.55 0.47 0.45 0.6 Set up a spreadsheet simulation model in whether Atlanta wins each game is a random variable. What is the probability that the Atlanta Braves win the World Series? If required, round your answer to two decimal places. What is the average number of games played regardless of winner? If required, round your answer to one decimal place.arrow_forward
- Identify the range of feasibility for the right-hand-side values. (If there is no upper or lower limit, enter NO LIMIT.) constraint 1 ______ to_______ constraint 2 ______to_______ constraint 3 ______to_______arrow_forwardA rapidly expanding company is looking to lease a small plant in Memphis, Tennessee, Biloxi, Mississippi, or Birmingham, Alabama. Prepare a cost benefit study for each of the three locations using the following data: The annual construction, facilities, and administration expenses for Memphis, Biloxi, and Birmingham will be $40,000, $60,000, and $100,000, respectively. In Memphis, labour and materials are estimated to cost $8 per month, $4 in Biloxi, and $5 in Birmingham. The Memphis site would add $50,000 a year to device transportation expenses, the Biloxi location would add $60,000 per year, and the Birmingham location would add $25,000 per year. The annual production is expected to be 10,000 units.arrow_forwardA firm has prepared the following binary integer program to evaluate a number of potential locations for new warehouses. The firm’s goal is to maximize the net present value of their decision while not spending more than their currently available capital. Max 15x1 + 25x2 + 15x3+ 35x4s.t. 8x1 + 11x2 + 6x3 + 6x4 ≤ 17 {Constraint 1}x1 + x2 + x3 + x4 ≥ 2 {Constraint 2}x1 + x2 ≤ 1 {Constraint 3}x1 + x3 ≥ 1 {Constraint 4}x2 = x4 {Constraint 5} xj = 0, 1 Solve this problem to optimality and answer the following questions: Which of the warehouse locations will/will not be selected? Location 1 will Answer Location 2 will Answer Location 3 will Answer Location 4 will Answer What is the net present value of the optimal solution? (Round your answer to the nearest whole number.) Net present value Answer How much of the available capital will be spent (Hint: Constraint 1 enforces the available capital limit)? (Round your answer to the nearest whole number.) Available capital Answerarrow_forward
- Al, Barbara, Carol, and Dave have joined together to purchase two season tickets to the Giants’ home football games. Because there are eight home games, each person will get tickets to two games. Each person has ranked the games they prefer from 1 to 8, with 1 being most preferred and 8 least preferred, as follows: Determine the two games each person should get tickets for that will result in the groups’ greatest degree of satisfaction. Do you think the participants will think your allocation is fair?arrow_forwardThe government is auctioning off oil leases at twosites. At each site, 100,000 acres of land are to be auctioned. Cliff Ewing, Blake Barnes, and Alexis Pickensare bidding for the oil. Government rules state that nobidder can receive more than 40% of the land beingauctioned. Cliff has bid $1000 per acre for site 1 landand $2000 per acre for site 2 land. Blake has bid $900per acre for site 1 land and $2200 per acre for site2 land. Alexis has bid $1100 per acre for site 1 landand $1900 per acre for site 2 land.a. Determine how to maximize the government’srevenue with a transportation model.b. Use SolverTable to see how changes in thegovernment’s rule on 40% of all land beingauctioned affect the optimal revenue. Why canthe optimal revenue not decrease if this percentage required increases? Why can the optimalrevenue not increase if this percentage requireddecreases?arrow_forwardMaximus Steel plans to introduce one of three new products code-named: Wren, Hawk, and Nightingale. The marketing department indicated that the success of any product depends on the market conditions (Favorable, Neutral, or Unfavorable). The profit the company will earn also depends on the market conditions. The table below shows the probability estimated for each market condition and the profits Maximus Steel will realize within those conditions: Product Code Market Conditions Favorable P = 0.2 Neutral P = 0.7 Unfavorable P = 0.1 Wren $120,000 $70,000 ($30,000) Hawk $60,000 $40,000 $20,000 Nightingale $35,000 $30,000 $30,000 Maximus Steel is considering hiring a market research firm to do a survey to determine future market conditions. The results of the survey will indicate either positive or negative market conditions. There is a 0.60 probability of a positive report, given favorable conditions; a 0.30 probability of a positive…arrow_forward
- formulate a linear program Vince Oliver plans to invest P 30,000 in municipal bonds, savings bonds, and treasury bills. He wishes to invest a minimum of P 5,000 in each of the three. If the interest rates are 12% for municipal bonds, 8% for savings bonds, and 10% for treasury bills, how much should he invest in each?arrow_forwardFormulate a system of equations for the situation below and solve.Cantwell Associates, a real estate developer, is planning to build a new apartment complex consisting of one-bedroom units and two- and three-bedroom townhouses. A total of 204 units is planned, and the number of family units (two- and three-bedroom townhouses) will equal the number of one-bedroom units. If the number of one-bedroom units will be 3 times the number of three-bedroom units, find how many units of each type will be in the complex. one-bedroom units units two-bedroom townhouses units three-bedroom townhouses unitsarrow_forwardThe Nature and Wildlife Corporation has manufacturing facilities in country A and an assembly plant in country B. In June 2020, the company will ship 1,000 units with a production cost of $65 per unit to its plant in country B. Its operating expenses in country A are $15,000 for the month. The income tax rate in country A is 20% and in country B it is 40%. The company plans to have a transfer price of $100 per unit. The final product can be sold in country B for $140. Country B’s operating expenses are $10,000 during the month. Could the company benefit by changing the transfer price to $120?arrow_forward
 Practical Management ScienceOperations ManagementISBN:9781337406659Author:WINSTON, Wayne L.Publisher:Cengage,
 Operations ManagementOperations ManagementISBN:9781259667473Author:William J StevensonPublisher:McGraw-Hill Education
 Operations and Supply Chain Management (Mcgraw-hi...Operations ManagementISBN:9781259666100Author:F. Robert Jacobs, Richard B ChasePublisher:McGraw-Hill Education
 Purchasing and Supply Chain ManagementOperations ManagementISBN:9781285869681Author:Robert M. Monczka, Robert B. Handfield, Larry C. Giunipero, James L. PattersonPublisher:Cengage Learning
 Production and Operations Analysis, Seventh Editi...Operations ManagementISBN:9781478623069Author:Steven Nahmias, Tava Lennon OlsenPublisher:Waveland Press, Inc.